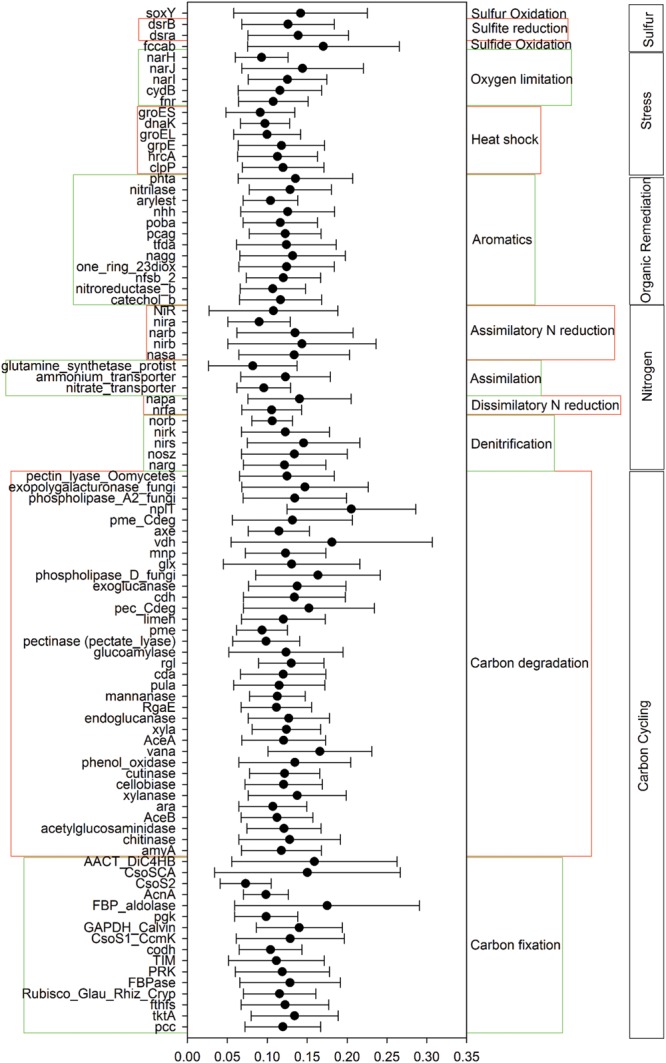
FIGURE 2.

Specific functional gene categories that exhibited significant changes in abundance from coniferous forest (1600 m) to bich forest at the treeline ecotone (1900 m). Significance was determined using the response ratio analysis at a 95% confidence interval (CI).
