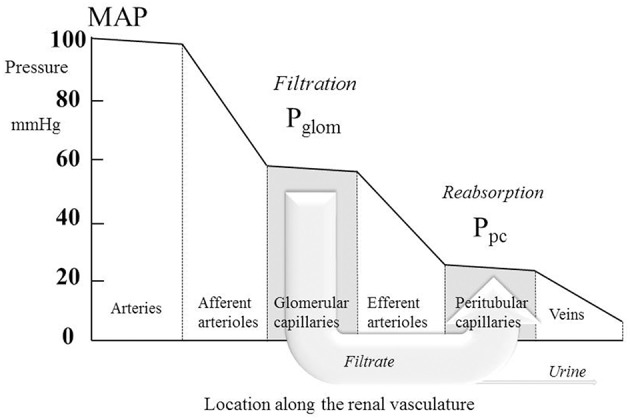
Figure 1.

The profile of hydrostatic pressures along the renal vasculature, showing typical normal values. MAP, mean arterial pressure; Pglom, glomerular pressure; Ppc, peritubular capillary pressure. The large arrow labeled “Filtrate” is a cartoon representation of the flow of glomerular filtrate, most of which is reabsorbed from the tubule into the peritubular capillaries. The small fraction of the filtrate that is not reabsorbed is depicted by the arrow labeled “Urine.”
