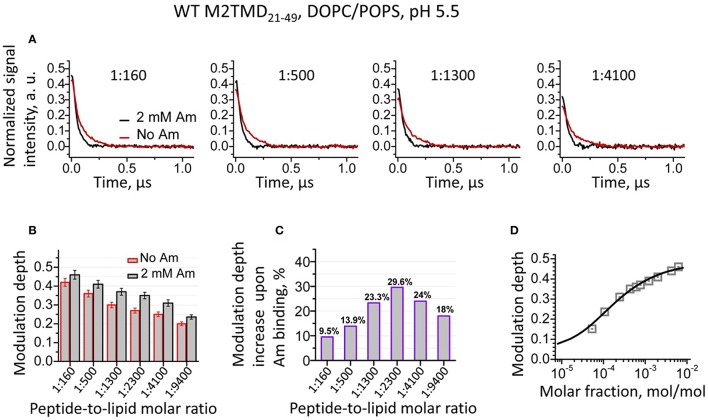
Figure 2.
(A) Background subtracted and normalized (as detailed in the supplement, cf. Supplementary Figure 2) DEER data for spin-labeled M2TMD21−49 in DOPC/POPS membranes at pH 5.5 and four P/L's, namely 1:160, 1:500, 1:1300, and 1:4100. The data without and with (2 mM) amantadine are in red and black, respectively. Samples with amantadine were incubated for 2 min at RT after two cycles of freeze/thaw, (cf. Experimental Procedures). Only the early 1.1 μs of the DEER signals are shown for clarity. (B) The DEER modulation depths for samples without and with amantadine for P/L's 1:160, 1:500, 1:1300, 1:2300, 1:4100, and 1:9400. The error bars correspond to the maximum uncertainty of ±5% in the modulation depth estimation (cf. Experimental Procedures). (C) Relative increase in DEER modulation depth upon addition of amantadine for the P/L's in (B). (D) DEER signal modulation depth concentration profile (open gray squares) is plotted vs. M2TMD21−49 molar fraction in DOPC/POPS lipid mixture with amantadine. The solid line is the fit of these data to the equilibrium model based on tandem momomer↔dimer↔tetramer. The obtained equilibrium constants, k2d, k4d are 39·10−6MF and 42·10−6MF, pointing to stronger bound tetramers than in the absence of the drug.

