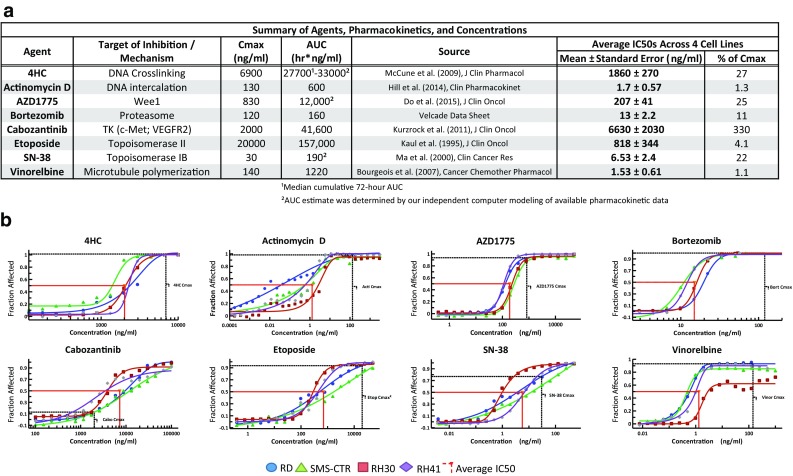
Fig. 1.

Single-agent activities of 8 therapeutic compounds screened against 4 RMS cell lines. a PK and IC50 values of the 8 drug candidates for the 4 RMS lines and comparison with clinically derived in vivo Cmax values. b Full dose–response curves of the drug candidates demonstrating single-agent cytotoxicity in the 4 RMS cell lines. The red lines indicate the in vitro IC50 levels and the black lines indicate the serum Cmax of each drug
