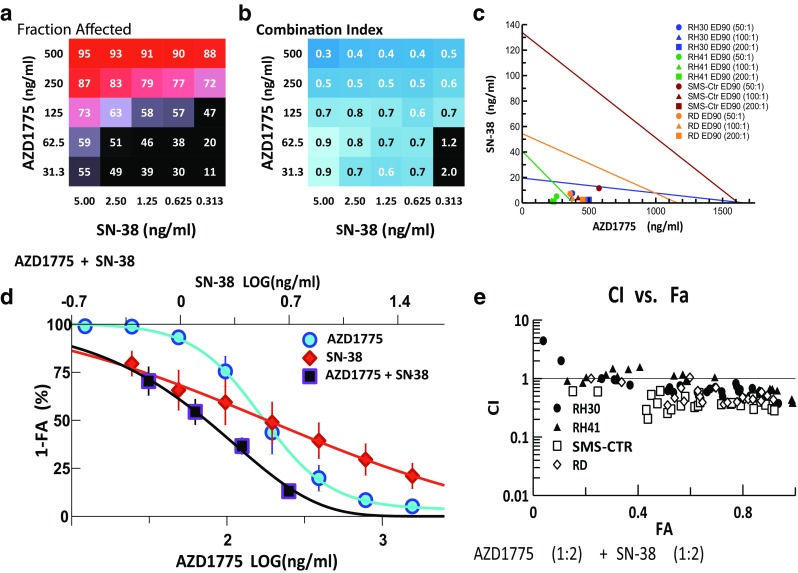
Fig. 4.

Combination activity for AZD1775 and SN-38. a FA and b CI values of AZD1775 and SN-38 assessed at 25 different concentrations. c Isobologram analysis of the combination demonstrating synergy at ED90 with 3 different drug ratios. d Single and combination drug–response curves for the combination showing cytotoxicity of the drug combination compared to single agent. e CI–FA plot showing synergy in all 4 RMS cells lines across a broad arrange of FA values in this drug combination
