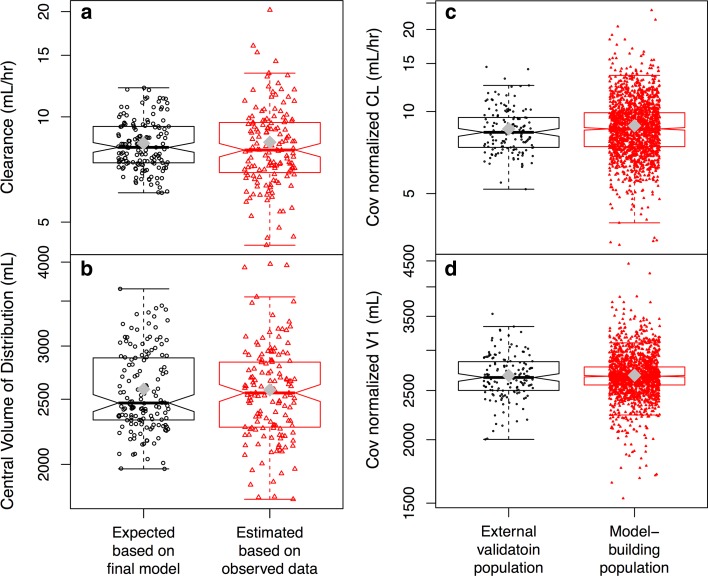
Fig. 4.
Comparison between (a, b) individual CL (a) and V1 (b) calculated based on individual covariate values using the equations in the final model without considering observed concentrations and post hoc estimates of CL and V1 obtained based on observed concentrations and the final model in the external validation population, and between (c, d) post hoc Bayesian estimates of CL (c) and V1 (d) of the model-building population and external validation population after normalization by individual covariate values that were included in the final model. Gray diamond in the boxplots represents the mean. CL clearance, Cov covariates included in the final model. V1 central volume of distribution. In Fig. 4c, d, data points with CL < 3 mL/h (n = 2) or V1 < 1500 mL (n = 1) are not displayed

