
Figure 5.
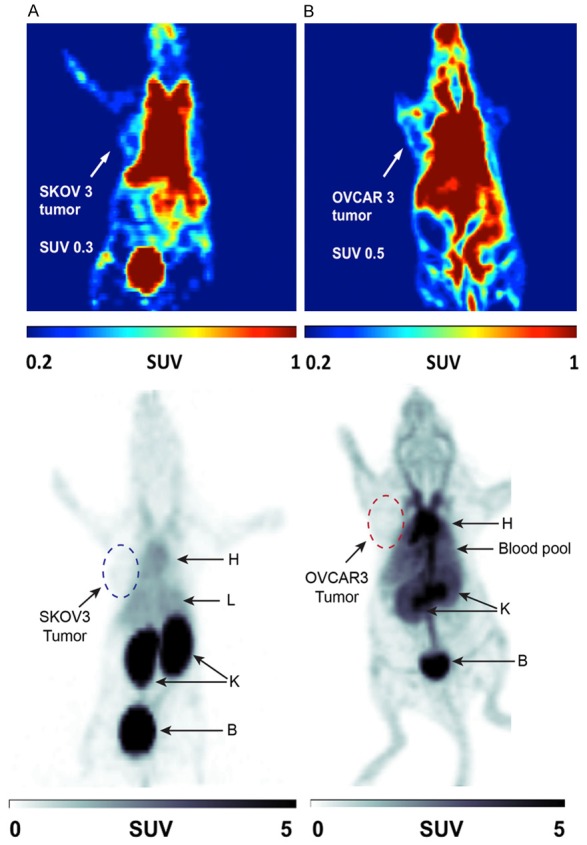
In vivo Small Animal PET Imaging Analysis. Representative PET images of NIH-III mice subcutaneously xenografted with (A) SKOV3 (CA125-negative) tumors and (B) OVCAR3 (CA125-positive) tumors on the left shoulder. The mice were intravenously injected with ~7 MBq of [18F]FBz-B43.13-scFv in 150 μL saline through the tail vein and dynamic PET imaging was performed for 1 h. The top panel shows coloured coronal planar slices scaled from SUV = 0.2 to 1.0 to delineate the tumor margins, whereas the lower panel shows a grayscale coronal slice of the same image scaled from SUV = 0 to 5 to highlight the differences of the distribution and clearance profile of the radiotracer between the two tumor xenograft models. At 1 h p.i., radiotracer [18F]FBz-B43.13-scFv accumulated more in kidneys (K) and bladder (B) of SKOV3-xenograft mice whereas it lingered longer in the blood pool (heart-H and liver-L) of OVCAR3-xenograft mice.