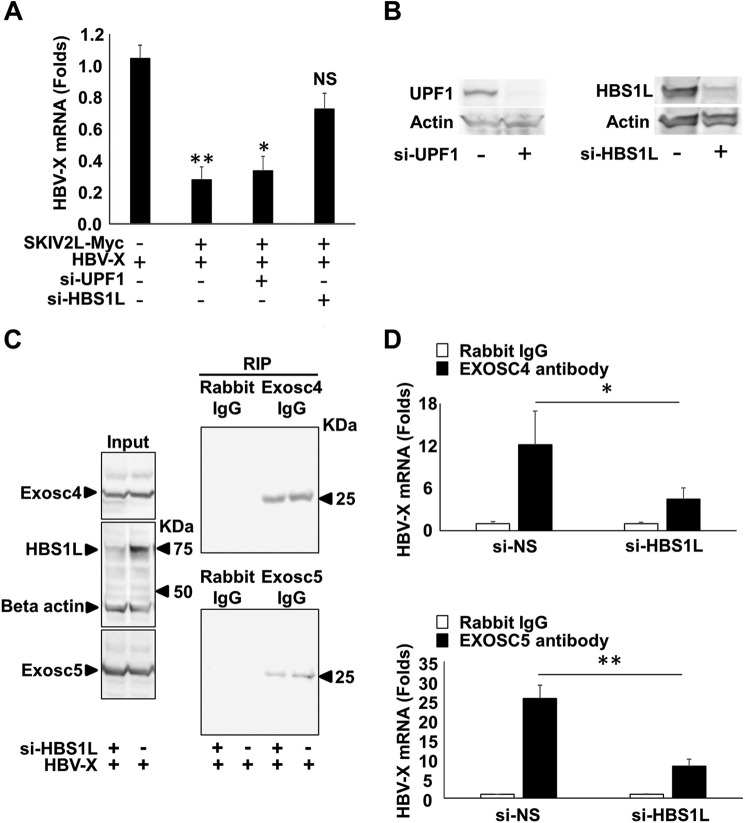
FIGURE 6.
HBS1L mediated interaction and suppression of HBV X-mRNA. A, HepG2 cells were transfected with either nonspecific siRNAs (NS) or with UPF1-specific (si-UPF1) or HBS1L-specific (si-HBS1L) siRNAs. 24 h later, the cells were co-transfected with pcDNA3.1-X together with pEF4-SKIV2L-MycHis or empty vector (pEF4-MycHis; mock). After 48 h, HBV-RNA levels were quantified by real-time RT-PCR. Data are plotted as -fold difference relative to mock-treated cells. Three independent experiments were performed in triplicate, and data are presented as the mean ± S.D. B, HepG2 cells were transfected with either nonspecific siRNAs or with UPF1-specific (si-UPF1) (upper panel) or HBS1L-specific (si-HBS1L) siRNAs (lower panel). 72 h later the cells were lysed, the cellular proteins were extracted, and the effect of the siRNAs silencing on the protein levels of its target gene were analyzed by immunostaining using the specific antibodies. C, 293T cells were transfected with either nonspecific or HBS1L (si-HBS1L) siRNAs. 24 h later, cells were transfected with pcDNA3.1-X plasmids as indicated. After 48 h, cell lysates were extracted. Aliquots (1/10 volumes) of the inputs were used for the detection of endogenous EXOSC4 (upper left panel), endogenous HBS1L and β-actin (loading control) (middle left panel), or endogenous EXOSC5 (lower left panel) by immunoblotting; separate aliquots (1/10 volumes) were used for RNA extraction and determination of HBV X-mRNA titers by real-time RT-PCR as shown in B. For the remaining lysate volumes, RIP assays were performed using either anti-EXOSC4, anti-EXOSC5 IgG, or isotype control antibody (rabbit IgG). EXOSC4 or EXOSC5 were detected in the output samples by immunoblotting (right upper and lower panels, respectively). D, HBV X-mRNA titers in EXOSC4, and -5 pulled down samples (upper and lower panels, respectively) were quantified relative to GAPDH mRNA titers in the same sample. HBV X-mRNA levels are plotted as -fold difference compared with levels in samples pulled down with isotype control antibody (mouse IgG). Data from three experiments are presented as the mean ± S.D. Statistical significance was measured was measured using two-tailed Student's t test. * = p < 0.05, ** = p < 0.01.

