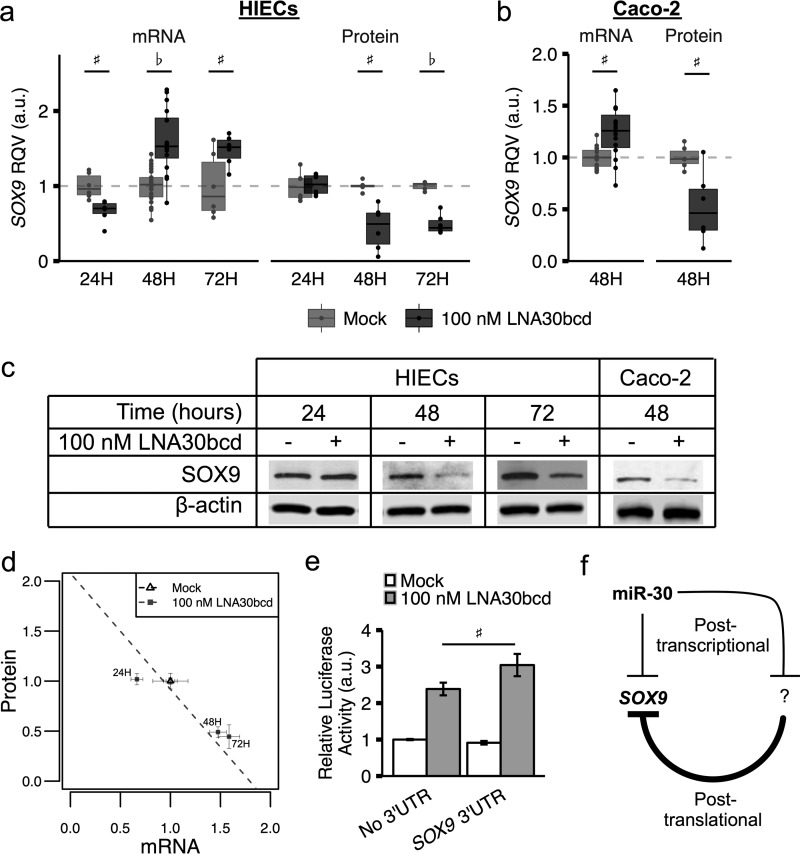
FIGURE 2.
Knockdown of miR-30 increases SOX9 mRNA and decreases SOX9 protein expression. a, relative quantitative value (RQV), across three time points, of SOX9 mRNA by RT-PCR (left panel) and protein by Western blot densitometry (right panel) in HIECs upon either mock transfection or 100 nm LNA30bcd transfection. b, RQV of SOX9 mRNA by RT-PCR (left panel) and protein by Western blot densitometry (right panel) in Caco-2 cells upon mock transfection or 100 nm LNA30bcd transfection after 48 h (mock and 100 nm LNA30bcd mRNA n = 15 each, protein n = 6 each). c, images of representative Western blots are shown for the protein expression data shown in a and b. d, correlation of mean RQVs of SOX9 mRNA and protein across time points and transfection conditions. e, relative firefly luciferase activity in Caco-2 cells at 48 h after transfection with plasmids encoding both firefly (with and without the SOX9 3′-UTR) and Renilla luciferase genes. Caco-2 cells were subjected to either mock co-transfection or 100 nm LNA30bcd co-transfection (n = 10–11 each). f, model of miR-30 regulation of SOX9 in the intestinal epithelium. For a and b, standard box and whisker plots are shown, with the shaded boxes indicating inner quartile ranges (IQR), the thick horizontal line showing median, and extending whiskers showing maximum and minimum points within 1.5*IQR. Actual data points are plotted as filled circles superimposed on their respective box and whisker plots. ♭, p < 0.001; #, p < 0.05.

