
FIGURE 3.
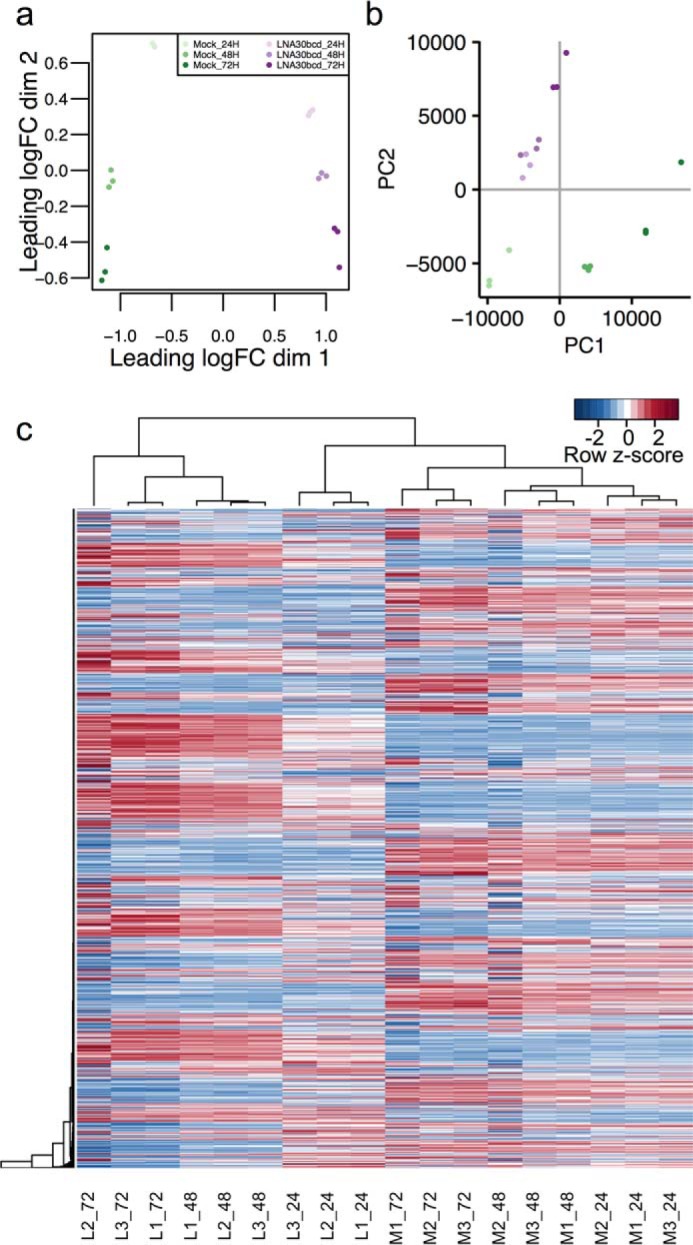
Next generation high throughput RNA sequencing of LNA30bcd-treated HIECs. a, multidimensional scaling plot of normalized reads (counts per million or CPM > 10 in ≥3 samples) in HIECs subjected to either mock transfection or 100 nm LNA30bcd transfection at 24 h (24H), 48 h (48H), and 72 h (72H) post-transfection (n = 3 each). b, principle components analysis of normalized reads (CPM > 10 in 3+ samples) across all time points and transfection conditions. c, heat map showing all genes with CPM > 10 in ≥3 samples (n = 10,096). Samples are hierarchically clustered by Euclidean distance. For each column, samples are listed along the bottom, with the first letter indicating mock treated (M) or 100 nm LNA30bcd-treated (L) HIECs, followed by the replicate number (replicate 1, 2, or 3), and the time point post-transfection (24, 48, or 72 h).