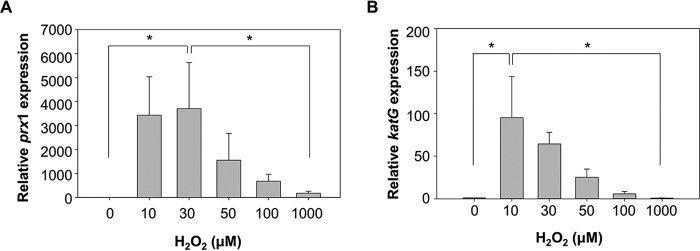
FIGURE 5.
Expression levels of prx1 and katG in response to various levels of H2O2. Wild-type V. vulnificus was grown anaerobically to an A600 of 0.3 and exposed to various concentrations of H2O2 as indicated for 3 min. Total RNAs were isolated, and the relative levels of prx1 (A) and katG (B) transcripts were determined by quantitative real-time PCR analyses. The level of each transcript from wild type unexposed to H2O2 is presented as 1. *, statistically significant difference (p < 0.05) between groups. All data represent mean ± S.D. (error bars).

