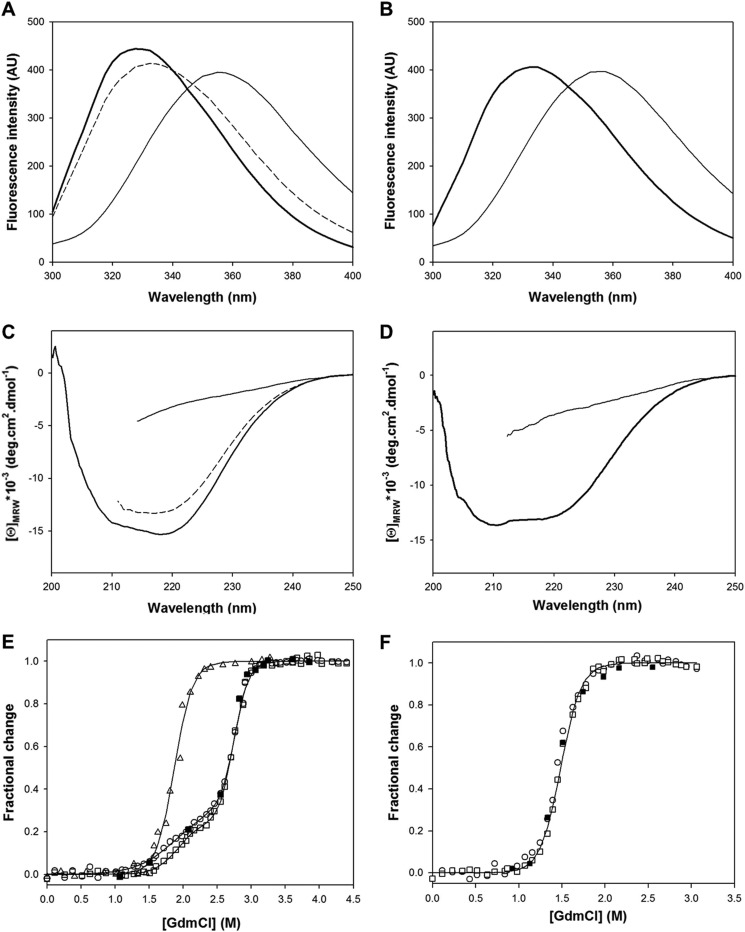
FIGURE 2.
Fluorescence (A and B) and far-UV CD (C and D) spectra of native ([GdmCl] = 0 m, thick line), partially folded ([GdmCl] = 2.4 m, dashed line), and unfolded ([GdmCl] = 4 m, thin line) forms of holoBcII (A and C) and apoBcII (B and D) are shown. GdmCl-induced equilibrium unfolding transitions of holoBcII (E) and apoBcII (F) BcII at pH 7.5 and 25 °C, monitored by the change in fluorescence intensity at 370 nm (□), CD at 222 nm (○), and enzyme activity (▵; holoBcII only); ■ corresponds to the refolding of BcII after 12 h of incubation in 6 m GdmCl, monitored by the change in fluorescence intensity at 370 nm. Data are shown as the fractional change in signal (99) at each GdmCl concentration; they were analyzed on the basis of two- and three-state models for apoBcII and holoBcII, respectively, and the solid lines represent the best fit calculated using the thermodynamic values in Tables 1 and 2, respectively. The curve for holoBcII unfolding followed by activity measurements is there to guide the eye only.

