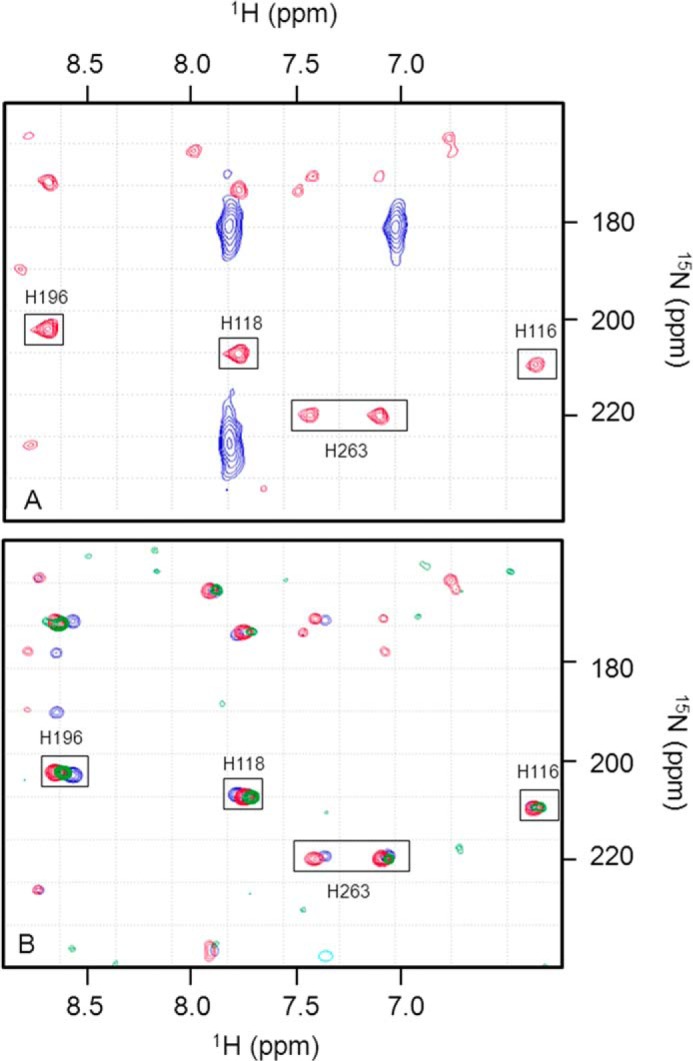
FIGURE 3.

Two-dimensional 1H-15N HSQC spectra for histidine imidazole observation. A, superimposition of data obtained for native BcII in the presence (holoBcII, in red) and absence (apoBcII, in blue) of zinc ions, with no GdmCl. B, superimposition of signals observed for holoBcII in the presence of 0 m (blue), 2.25 m (red), and 2.5 m (green) GdmCl. Note that standard BBL numbering system only is used.
