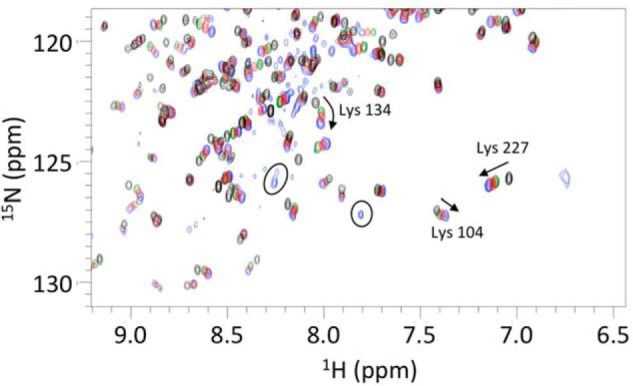
FIGURE 6.

Overlay of two-dimensional 1H-15N HSQC spectra of holoBcII in the presence of various GdmCl concentrations: 0 m (black); 1 m (green); 1.6 m (blue), and 2.34 m (pink). Arrows indicate shifts and their directions; circles are for peaks corresponding to the unfolded protein in 2.34 m GdmCl, and arcs indicate non-linear CSPs. Residues are numbered as in the sequence, i.e. Lys-104(135), Lys-134(181), and Lys-227(291).
