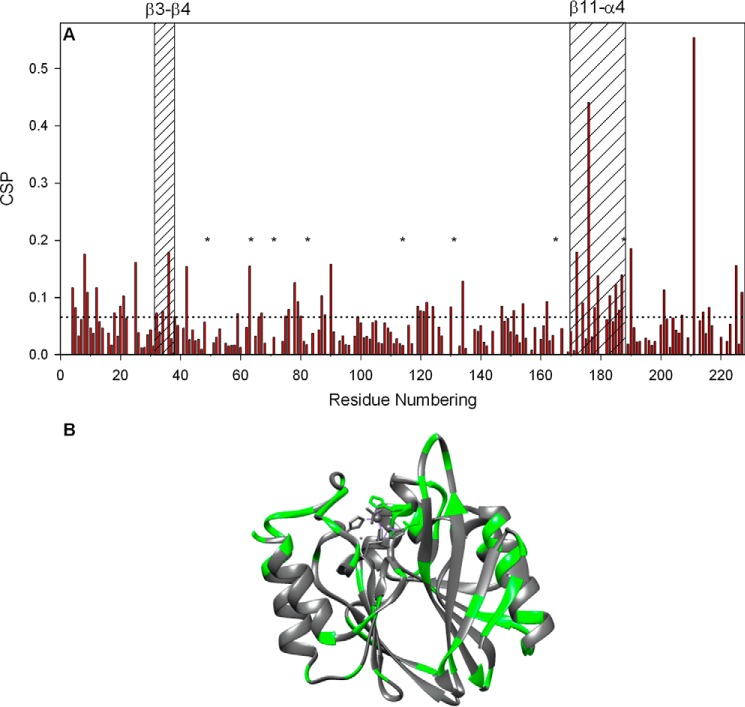
FIGURE 7.
A, combined CSPs between 0 and 2. 34 m GdmCl, calculated using Equation 2 and shown as histograms versus the BcII amino acid sequence. The dashed line represents the threshold (0.064 ppm) for significant chemical shift perturbations calculated as described under “Experimental Procedures.” With residues Ile-83(113), Glu-151(198), Val-165(218), and Lys-176(229), estimation of the CSPs was done by linear extrapolation. The eight residues (Lys-50(78), Thr-64(92), Glu-72(100), Ile-83(113), Ala-115(146), Thr-131(178), Val-165(218), and Glu-188(243)) whose signals disappeared completely as GdmCl concentration was increased above 0.75 m (see text) are indicated by asterisks. Sequence elements corresponding to loops β3-β4 and β11-α4 are indicated; B, schematic ribbon representation of the structure where green areas represent those residues undergoing significant CSPs.

