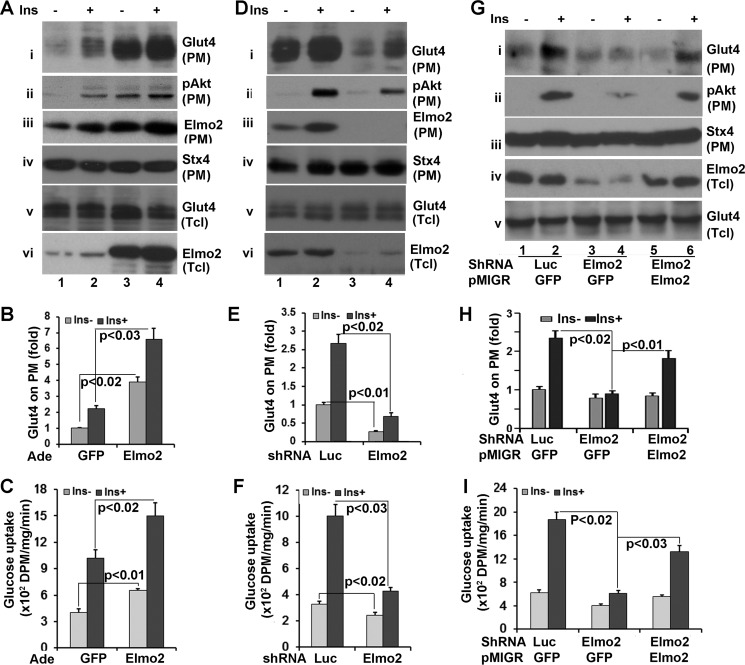
FIGURE 6.
Elmo2 regulates insulin-dependent Glut4 membrane translocation in L6 skeletal muscle cells. A, ectopic expression of Elmo2 in L6 cells enhances insulin-dependent Glut4 membrane translocation. L6 cells were transduced with adenoviral vectors coding for either GFP or FLAG-Elmo2. Transduced L6 cells were serum-deprived for 6 h and treated with 100 nm insulin for 15 min. Then PM was prepared through a subcellular fractionation assay and analyzed by Western blotting with anti-Glut4 (i), anti-phospho-Akt (ii), and anti-syntaxin 4 (Stx4), respectively. v and vi show the levels of Glut4 and Elmo2 in total cell lysates, respectively. B, densitometric analysis of Glut4 on PM. The amount of Akt on PM from GFP-expressing cells without insulin treatment was set as 1 after normalization to PM syntaxin 4 and total cellular levels of Akt. The bar graphs show means ± S.D. (error bars) (n = 3). In all cases, p < 0.032. C, ectopic expression of Elmo2 enhances L6 glucose uptake. L6 cells were transduced with adenoviral vectors coding for either GFP or FLAG-Elmo2. Transduced L6 cells were serum-deprived for 6 h and treated with 100 nm insulin for 15 min. The glucose uptake assay was carried out as described under “Experimental Procedures.” The bar graphs show means ± S.D. (n = 3). In all cases, p < 0.033. D, Elmo2 knockdown in L6 cells suppresses insulin-dependent Glut4 membrane translocation. The experiments were carried out in essentially the same manner as in A, except adenoviral vectors that express either luciferase shRNA or Elmo2 shRNA were used. E, densitometric analysis of Glut4 on PM. The amount of Akt on PM from luciferase shRNA-expressing cells without insulin treatment was set as 1 after normalization to PM syntaxin 4 and total cellular levels of Akt. The bar graphs show means ± S.D. (n = 3). In all cases, p < 0.023. F, Elmo2 knockdown in L6 cells suppresses glucose uptake. The experiments were carried out in a manner similar to that described in C, except the cells were transduced with adenoviral vectors expressing either luciferase shRNA or Elmo2 shRNA. The bar graphs show means ± S.D. (n = 3). In all cases, p < 0.029. G, forcing expression of Elmo2 in Elmo2 shRNA-expressing cells rescues insulin-dependent Glut4 membrane translocation. L6 cells transduced with Elmo2 shRNA expressing adenoviral vectors were infected with pMigR1 retrovirus coding for either GFP or an Elmo2 shRNA-resistant Elmo2 (see “Experimental Procedures”). 48 h post-infection, the cells were serum-deprived for 6 h, followed by a 15-min insulin treatment. Then PM was prepared through a subcellular fractionation assay and analyzed by Western blotting with anti-Glut4 (i), anti-Akt (ii), and anti-syntaxin 4 antibodies, respectively. iv and v show the levels of Elmo2 and Glut4 in total cell lysates, respectively. H, densitometric analysis of Glut4 on PM. The amount of Glut4 on PM from GFP-expressing cells that were infected with GFP-expressing pMigR1 without insulin treatment was set as 1 after normalization to PM syntaxin 4 and total cellular levels of Glut4. The bar graphs show means ± S.D. (n = 3). In all cases, p < 0.022. I, forcing expression of Elmo2 in Elmo2 shRNA-expressing cells rescues the defect in glucose uptake. L6 cells were transduced with viral vectors as in G, and a glucose uptake assay was carried out. The bar graphs show means ± S.D. (n = 3). In all cases, p < 0.037.

