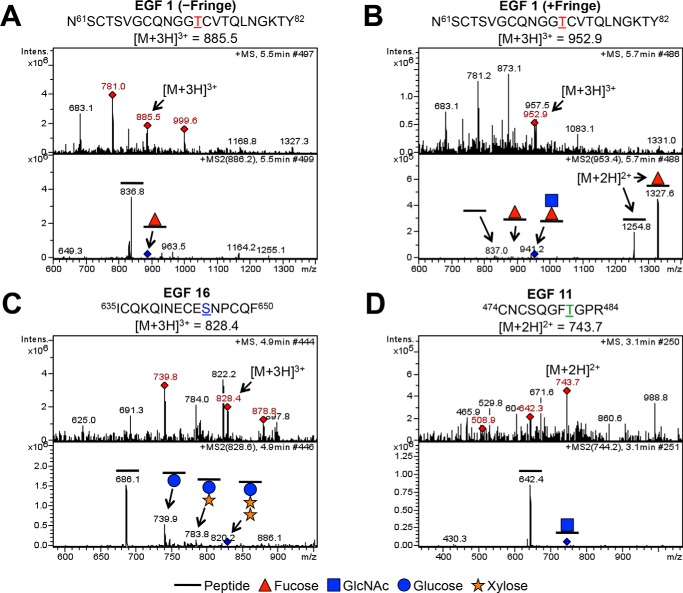
FIGURE 2.
O-Fucosylation, O-glucosylation, and O-GlcNAcylation of EGF repeats 1–36 from Notch ECD. Examples of mass spectra for the three major types of O-glycosylation are shown (A–D). Top panels, MS spectra; red diamonds, ions chosen for fragmentation. Parent ions corresponding to specified glycosylated peptides (A, EGF1 m/z = 885.5; B, EGF1 m/z = 952.9; C, EGF16 m/z = 828.4; D, EGF11 m/z = 743.7) are fragmented to produce MS2 spectra, shown in the bottom panels. Other ions in the MS spectra are from co-eluting material. Blue diamonds in MS2 spectra indicate the position of the parent ion. A, mass spectra showing the peptide 61NSCTSVGCQNGGTCVTQLNGKTY82 from EGF1 in the +3 charge state. The peptide generated in the absence of Fringe shows a neutral loss of a fucose. B, mass spectra showing the same peptide from EGF1 in the +3 charge state, now generated in the presence of Fringe, shows sequential neutral losses of GlcNAc and fucose. Loss of fucose from the same peptide in the +2 charge state is seen to the right of the parent ion in the MS2 spectrum. A and B, asparagine residue before amino acid 61 comes from the vector and is not part of the Notch sequence. C, mass spectra showing the peptide 635ICQKQINECESNPCQF650 from EGF16 in the +3 charge state. Sequential neutral loss of two xyloses and a glucose is seen in the MS2 spectra. D, mass spectra showing the peptide 474CNCSQGFTGPR484 from EGF11 in the +2 charge state. A neutral loss consistent with that of a GlcNAc is seen in the MS2 spectra. Spectra analyzing O-glucosylation and O-GlcNAcylation were taken from Notch generated in the absence of Fringe. Red triangle, fucose (deoxyhexose); blue circle, glucose (hexose). Orange star, xylose (pentose). Blue square, GlcNAc (HexNAc).

