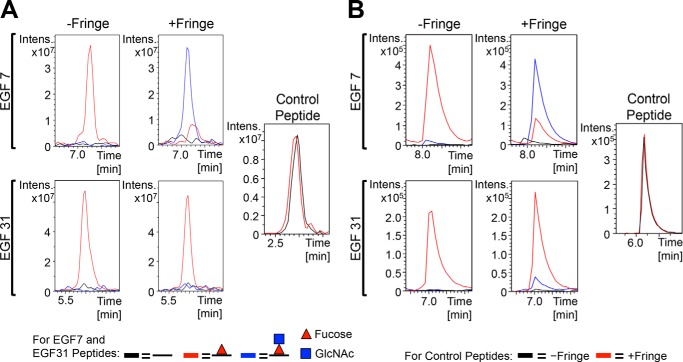
FIGURE 3.
Comparison of extracted ion chromatograms and multiple-reaction monitoring for semiquantitative analysis of glycosylation. EICs (A) and MRM chromatograms (B) show the relative levels of unmodified (black line), O-fucose monosaccharide (red line), and O-fucose disaccharide (blue line) glycoforms of peptides 289NCEQNYDDCLGHLCQNGGTCIDGISDYTCR318 from EGF7 and 1211QGFQGQNCELNIDDCAPNPCQNGGTCHDR1239 from EGF31. Internal unglycosylated control peptides used were 272SNGLSYECK280 from EGF6 (A) and 1200DLIGAYECQCR1210 from EGF30 (B) from samples generated in the absence of Fringe (black line) or presence of Fringe (red line). Lists of the ions used for each glycoform in the EICs and MRM chromatograms are provided in supplemental Fig. S3.

