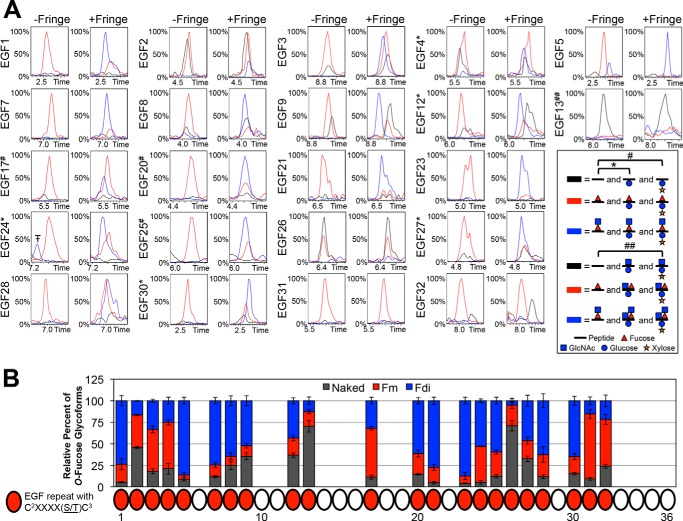
FIGURE 4.
O-Fucosylation occurs at high stoichiometry, but Fringe elongation is site-specific. A, representative EICs showing the relative intensities of unmodified (black line), O-fucose monosaccharide (red line), and O-fucose disaccharide (blue line) glycoforms of peptides containing each predicted O-fucose site in the absence of Fringe (−Fringe) and presence of Fringe (+Fringe). Peptides searched in each EIC are listed in Table 1, and corresponding spectra are shown in supplemental Fig. S3. EICs of O-fucose sites represented by peptides also containing an O-glucose site include searches for O-glucose monosaccharide (*) and O-glucose disaccharide (#). The peptide corresponding to the EGF13 O-fucose site also contained an O-glucose and O-GlcNAc site (##). There is a small amount of O-fucose disaccharide observed on EGF5 in the absence of Fringe, suggesting that there are low levels of endogenous Fringe activity in S2 cells, and EGF5 is the most sensitive to that activity. Additional combinations of O-fucose, O-glucose, and O-GlcNAc glycoforms were searched; however, none were present in significant amounts, and therefore, they are not included in the chromatograms shown. Time is represented in minutes. Red triangle, fucose (deoxyhexose). Blue circle, glucose (hexose). Orange star, xylose (pentose). Blue square, GlcNAc (HexNAc). The peak indicated byT–corresponds to a contaminating ion with the same parent ion mass as the ion of interest, within the specified mass precision range of ±0.5 Da used in the EIC. B, peak areas of each O-fucose glycoform were quantified and represented as a percentage of the total peak area from each EIC (see “Experimental Procedures” for more information). Error bars, S.E.

