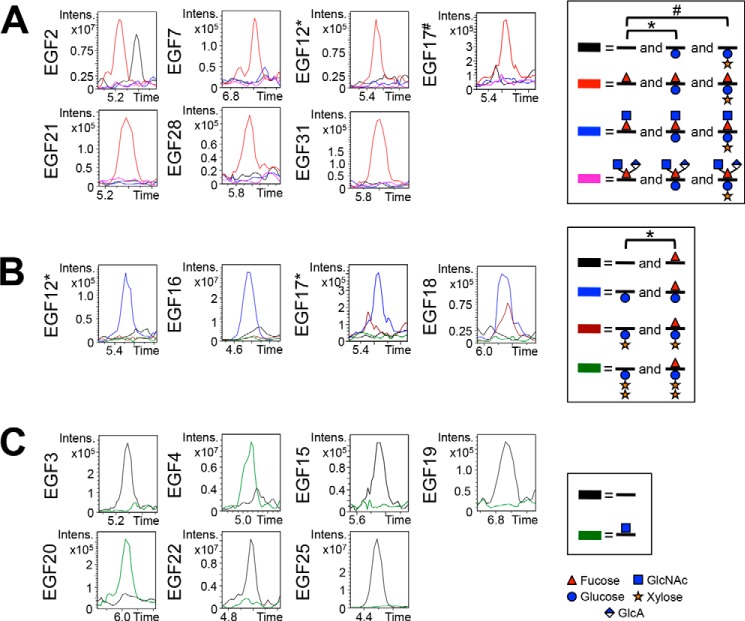
FIGURE 8.
O-Glycosylation on endogenous Notch is similar to that seen from S2 cells. EICs showing O-fucosylation (A), O-glucosylation (B), and O-GlcNAcylation (C) of peptides from several EGF repeats from endogenous Notch protein purified from Drosophila. To more directly compare the O-glycosylation of endogenous Notch with Notch generated in S2 cells, only peptides analyzed from S2 cells were also analyzed from endogenous Notch (Table 1 and supplemental Fig. S3). Similar combinations of O-fucose, O-glucose, and O-GlcNAc glycoforms were seen modifying Notch produced in S2 cells. A, EICs showing the relative levels of unmodified (black line), O-fucose monosaccharide (red line), O-fucose disaccharide (blue line), and the novel O-fucose trisaccharide (pink line) for each predicted O-fucose site. EICs of O-fucose sites represented by peptides also containing an O-glucose site include searches for O-glucose monosaccharide (*) and O-glucose disaccharide (#). B, EICs showing the relative levels of unmodified (black line), O-glucose monosaccharide (blue line), O-glucose disaccharide (maroon line), and O-glucose trisaccharide (green line) for each predicted O-glucose site. Peptides searched in each EIC are listed in Table 1, and corresponding spectra are shown in supplemental Fig. S3. EICs of O-glucose sites represented by peptides also containing an O-fucose site include searches for O-fucose monosaccharide (*). C, EICs showing the relative levels of unmodified (black line) and O-GlcNAc (green line) for each predicted O-GlcNAc site. A–C, time is represented in minutes. Red triangle, fucose (deoxyhexose). Blue circle, glucose (hexose). Orange star, xylose (pentose). Blue square, GlcNAc (HexNAc). Half-blue diamond, GlcA.

