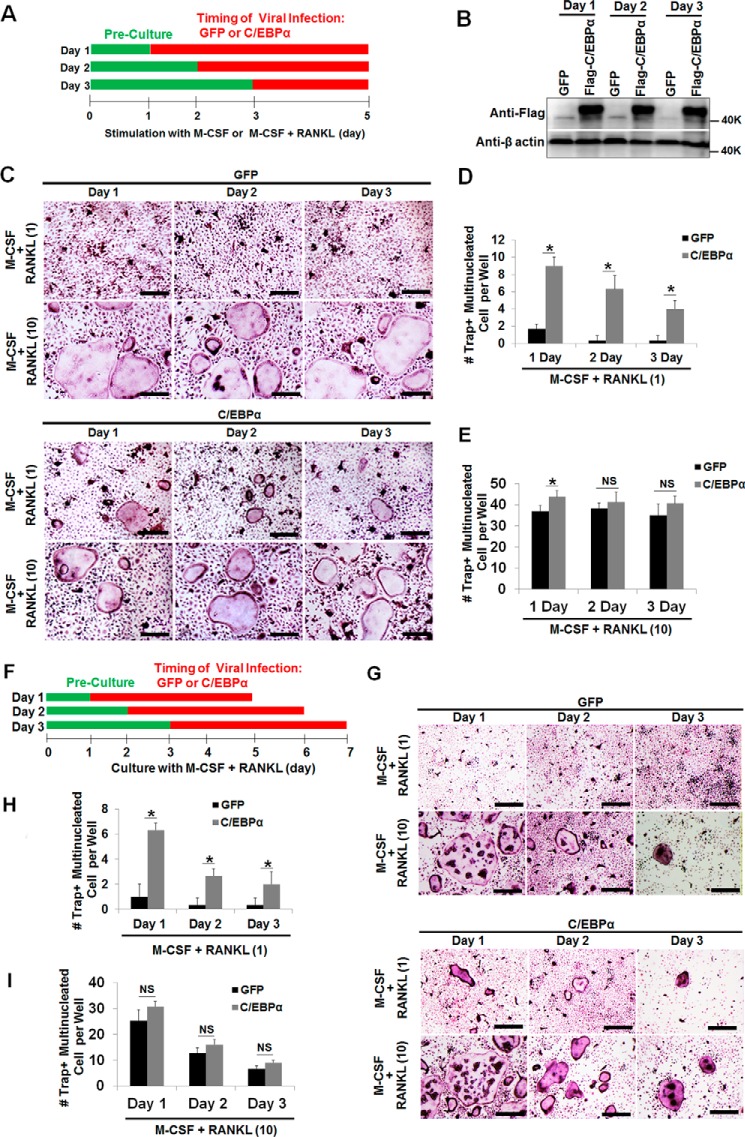
FIGURE 2.
C/EBPα overexpression plays a stronger role in the early stage of OC differentiation but is also important for the later stage. A, schematic of the research strategy for B–E. B, MBM cells were infected with a retrovirus encoding the GFP control (GFP) or FLAG-C/EBPα (C/EBPα) on day 1, 2, or 3 of osteoclastogenesis in the presence of M-CSF alone (10 ng/ml) for 24 h. The cultures were then continued for 5 days with M-CSF alone. Gene expression was examined by Western blotting using β-actin as a loading control. C, the same set of assays as in A was repeated, but cells were infected with a retrovirus for 24 h while undergoing treatment with M-CSF (10 ng/ml) plus RANKL (1 ng/ml) or M-CSF (10 ng/ml) plus RANKL (10 ng/ml) for 5 days. D and E, quantification of the assays in C for M-CSF + RANKL (1 ng/ml, D) or M-CSF + RANKL (10 ng/ml, E) in at least three independent experiments. F, schematic of the research strategy for G–I. G, MBM cells were infected with a retrovirus encoding the GFP control or C/EBPα on day 1, 2, or 3 of osteoclastogenesis with M-CSF (10 ng/ml) and RANKL (1 ng/ml) or M-CSF (10 ng/ml) plus RANKL (10 ng/ml) for 24 h. Following the infection, all cells were cultured with M-CSF (10 ng/ml) and RANKL (1 ng/ml) or M-CSF (10 ng/ml) plus RANKL (10 ng/ml) for 4 days. The cultures in C and G were stained for TRAP activity. H–I, quantification of the assays in G for M-CSF + RANKL (1 ng/ml, H) or M-CSF + RANKL (10 ng/ml, I) from at least three independent experiments. The numbers in parentheses show concentration in nanograms per milliliter. Error bars show averages ± S.D. *, p < 0.05; NS, not significant. Scale bars = 200 μm.

