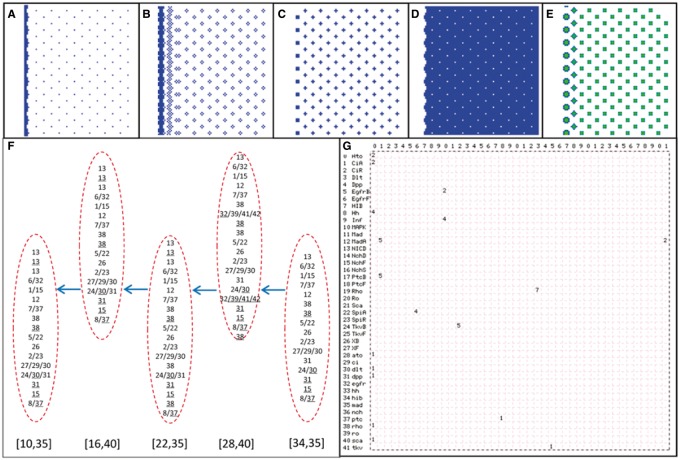
Fig. 2.
Simulation results. (A–D) The distribution of event Ato_Act_dlt, NICD_Rep_ato, EgfrB_Act_MAPK and Ro_Rep_ato at a time step in the 100 × 100 cell space. (E) The distribution of MAPK concentration at a time step in the 100 × 100 cell space. (F) The sequences of events in some R8s in different columns of ommatidia. Arrows indicate the movement of the MF. [34,35], [28,40], [22,35], [16,40] and [10,35] indicate the position of five R8s. (G) Events occurring at a time step form an emergent network; a stable network formed by continually occurring events indicates an attractor of signaling. Numbers in the top row, as in the left column, indicate the 42 molecules (Supplementary Table S1), and numbers in the lattice indicate events, including expression (Exp), binding (Bid), ubiquitination (Ubi), activation (Act) (Supplementary Table 2)

