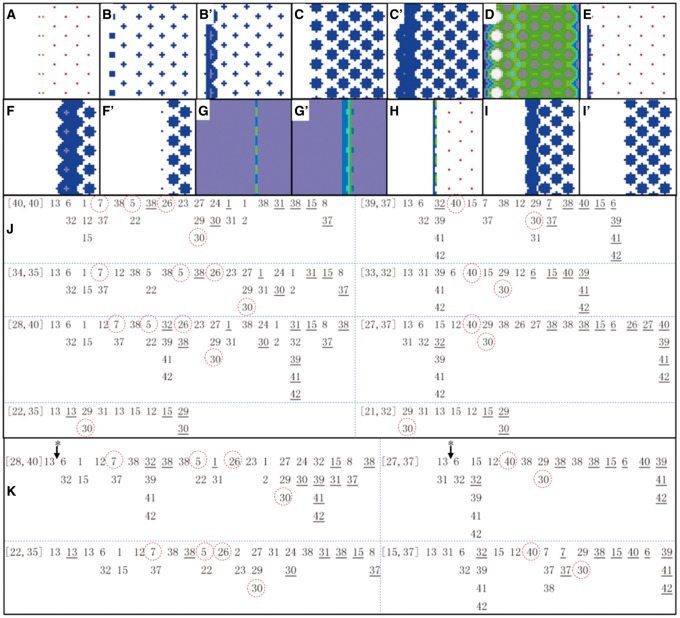
Fig. 3.
Impact of changed parameters and changed events on R8 patterning. (A–E) are distributions of Rho, Sca, SpiA, XB and Ato concentration, respectively, at some time steps under trNICD_ato = 0.003→0.0045. For comparisons, (B′) and (C′) are distributions of Sca and SpiA concentration at the same time steps under the default condition. This change of trNICD_ato causes ectopic (more posterior) ato expression (indicated by ectopic Rho at t = 588 in (A)), influences Notch signaling (indicated by Sca at t = 786 in (B)) and influences EGFR signaling (indicated by SpiA at t = 786 in (C)). New R8s are generated, but with a defect (indicated by XB and Ato at t = 860 in (D) and (E)). (F–I) are distributions of SpiA, CiA, ato and SpiA concentration at different time steps under taAto_rho = 0.35→0.175. For comparisons, (F′), (G′) and (I′) are distributions of SpiA, CiA and SpiA at the same time steps under the default condition. This change of taAto_rho activates rho expression and EGFR signaling earlier (indicated by SpiA at t = 307 in (F)). The change also influences Hh signaling via Ato (indicated by CiA at t = 371 in (G)), arrests R8 generation (indicated by ato at t = 426 in (H)) and influences EGFR signaling (indicated by SpiA at t = 475 in (I)). (J) The sequences of some events in the case taAto-rho = 0.35→0.175. [40,40] and [39,37] indicates cell position; events (as numbered in Supplementary Table S2, and ordered left-to-right) without and with an underline indicate the initiation and stop of the events; circled events are critical ones and follow rigorous orders. In R8 cells ([40,40], [34,35], [28,40], [22,35] at the left side) the order of events appears the same as that under the default condition (compare the marked 7, 5, 26, 30 with those in Fig. 2), but in the I cells ([39,37], [33,32], [27,37], [21,32] at the right side), the occurrence of the event NICD_Rep_ato is gradually postponed and the activation of ro becomes relatively earlier (see the marked 40, 30 in these cells). (K) When taAto_rho = 0.35→0.175 is corrected at t = 400 (indicated by * with an arrow), all columns of R8 are generated, but a correction made at t = 450 is not successful, because it is too late to correct the subsequent EGFR signaling and ro expression. Events 7, 5, 26, 30 shown in the two R8 cells ([28,40] and [22,35]), and events 40, 30 shown in the two I cells ([27,37] and [15,37]), follow the correct order, but the timing and their positions in the event sequences are different

