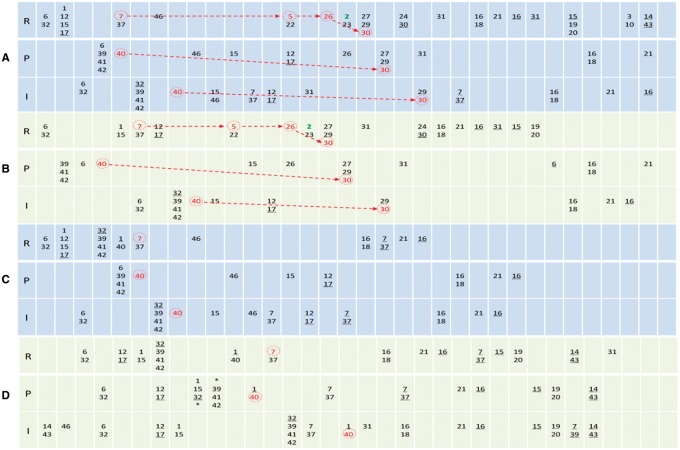
Fig. 4.
The sequences of events in an R8 cell, a P1 cell and an I cell during R8 patterning. In all panels, R, P and I indicate the R8 cell, the P1 cell and the I cell (see inset in Fig. 1). Events are numbered as in Supplementary Table S2 and ordered left-to-right. Columns help display the order of events but do not contain time information. Multiple numbers in a unit (and those with ‘*’ in two units) indicate concurrent events. Events without and with an underline indicate the initiation and stop of the events. Red numbers indicate key Notch/EGFR signaling events. The self-sustained Ato expression (event 2) follows event 7, 5 and 26 and marks the R8 fate. Notch and EGFR signaling, by repressing Ato expression in other cells, allows Ato_Exp_ato to occur only in R8 cells. Red events, together with event 2, are key events that make a cell R8, and they show specific orders in these cells in successful R8 patterning (A, B), but do not in unsuccessful R8 patterning (C, D). In non-R8 cells (and failed R8 cells), sequences of events vary more significantly as signaling is less constrained (note that the fate of these cells is undetermined at the moment of R8 determination). (A) With the default parameter setting, R8 patterning is correct. (B) With taAto_delta = 0.005, R8 patterning is correct. (C) With taXB_ro = 0.00825, R8 patterning fails. (D) With baseptc = 0.06, R8 patterning fails

