
Fig. 6.
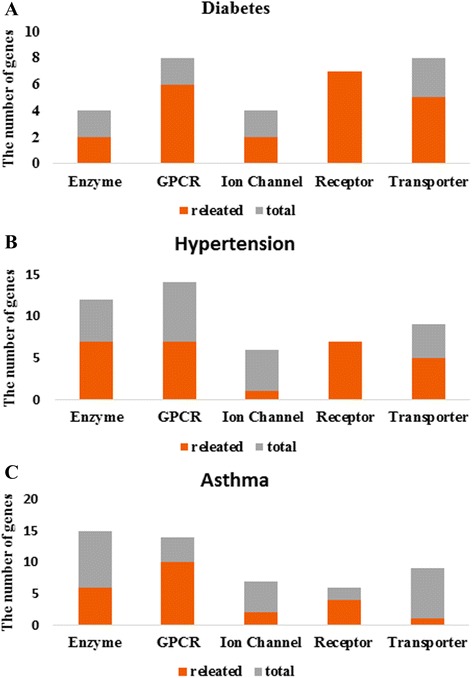
The number of predicted target proteins for each protein type in each phenotype. Part of the bottom indicates the number of target proteins that are related with each phenotype. a The number of predicted genes in diabetes. b The number of predicted genes in hypertension. c The number of predicted genes in asthma. Many proteins are related with each phenotype