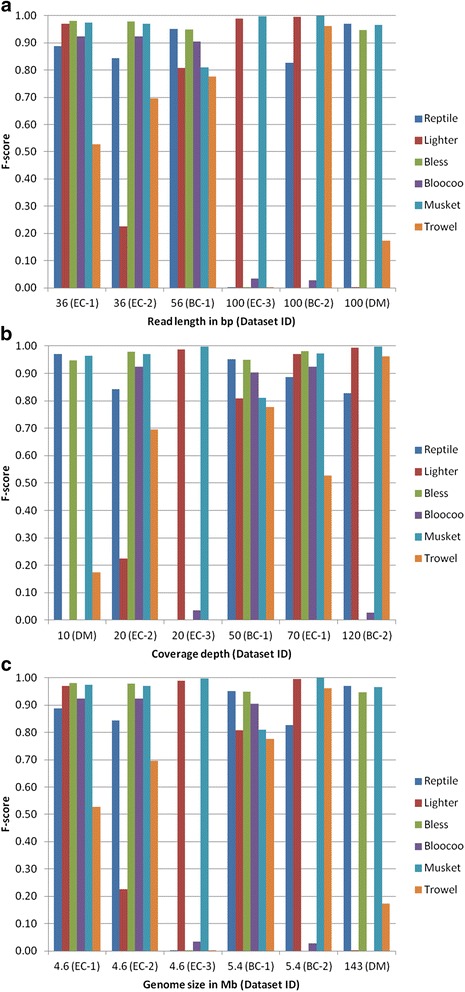
Fig. 3.

Impact of read length (a), coverage depth (b), and genome size (c) on the performance of six k-spectrum-based error correction methods. The six datasets are reordered according to the factor examined in order to show visually the effect of each factor on F-score for each method (see Table 3 for dataset, method, and F-score information)
