Fig. 11.

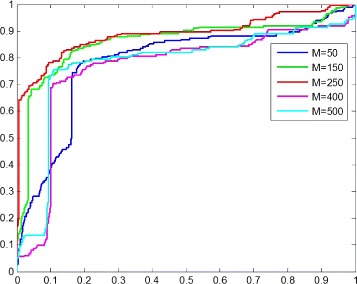
The ROC curve for the parameter sensitivity experiment. In this figure, M is the number of hidden units of the sparse autoencoder and we record the performances of the proposed model with M=50, 150, 250, 400, 500 respectively

The ROC curve for the parameter sensitivity experiment. In this figure, M is the number of hidden units of the sparse autoencoder and we record the performances of the proposed model with M=50, 150, 250, 400, 500 respectively