Fig. 9.

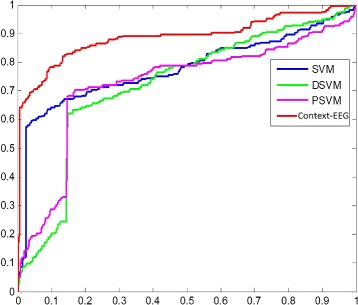
The ROC curves of the proposed model and the baselines. In this figure, the blue line is the ROC curve of SVM. The green ROC curve is for the DSVM and purple ROC is for the PSVM. The red curve is the ROC of Context-EEG

The ROC curves of the proposed model and the baselines. In this figure, the blue line is the ROC curve of SVM. The green ROC curve is for the DSVM and purple ROC is for the PSVM. The red curve is the ROC of Context-EEG