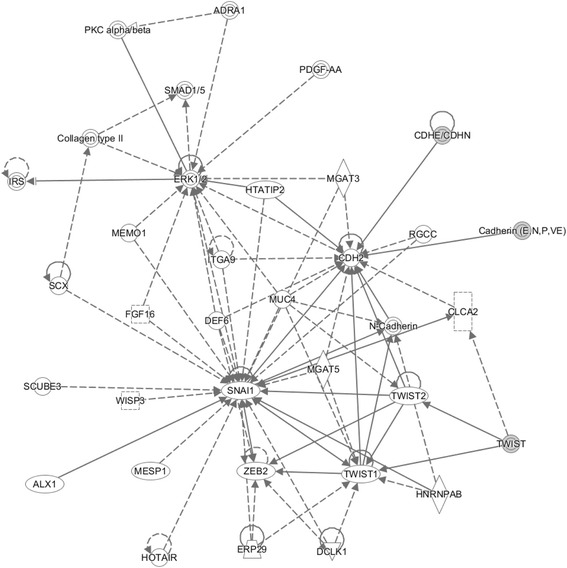
Fig. 14.

Gene network analysis. The target genes of cancer-induced differentially expressed protein were used to run the IPA tool for gene network analysis. These genes around triangles highlighted genes that are involved in immunity system development function. The network score described in the “Methods” section for the network is 39. The solid lines connecting the molecules here represent a direct relation and dotted lines an indirect relation
