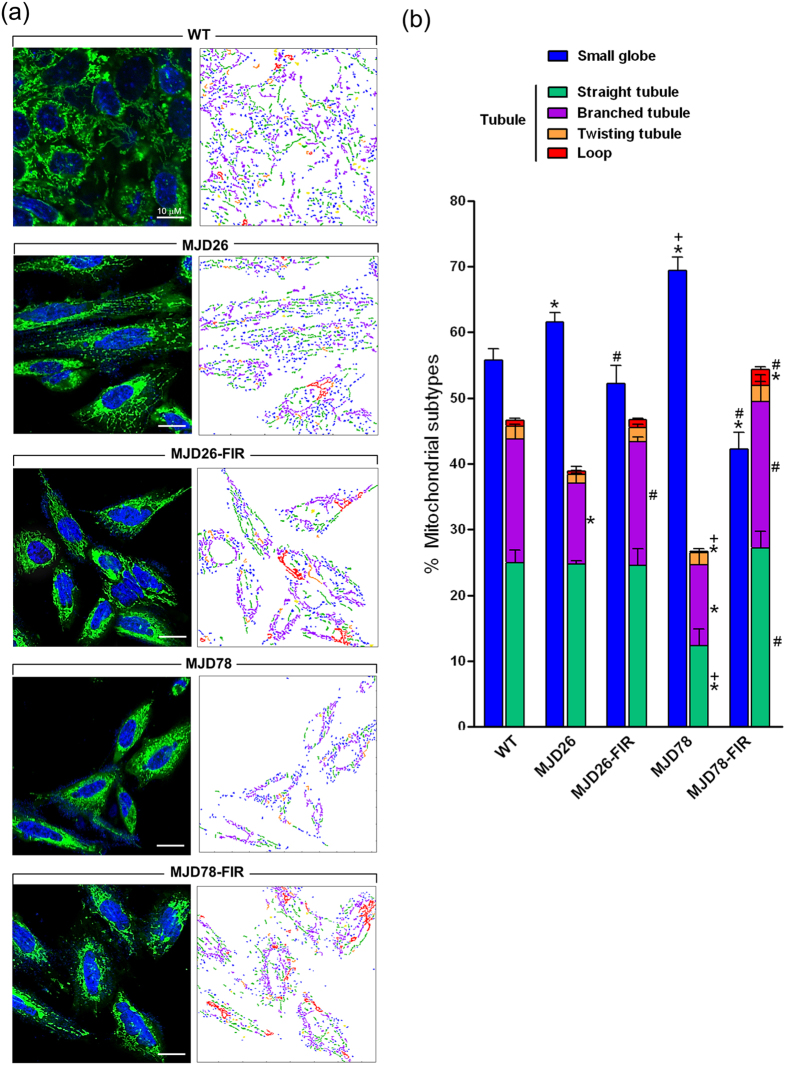
Figure 3. Alteration of mitochondrial morphology in FIR-treated MJD cells.
(a) Morphology of mitochondria stained by MitoTracker Green probe was observed by a confocal fluorescence microscope in MJD26 and MJD78 cells with or without 3-day FIR treatment. The classification and quantification of mitochondrial morphology were further analyzed by using an automatic system. The color-coded labeling showed the composition of mitochondrial subtypes in each group of representative cells as right-side panel shown in (a). The six distinct mitochondrial subtypes were classified as class 2 as follows: small globe (blue) and tubule including straight tubule (green), branched tubule (purple), twisting tubule (orange) and loop (red). The type of swollen globed (yellow) representative of dysfunctional mitochondria was excluded from the qualification of mitochondrial subtypes. (b) Mitochondrial subtypes were quantified by calculating the percentage of each mitochondrial subtype in total mitochondrial population. Images from three independent areas contained about 250–350 mitochondrial subjects from about 4–6 cells in each was analyzed at each group. *p < 0.05, compare to WT group; +p < 0.05, compare to MJD26 group; #p < 0.05, compare to each non-treated group of MJD cells.

