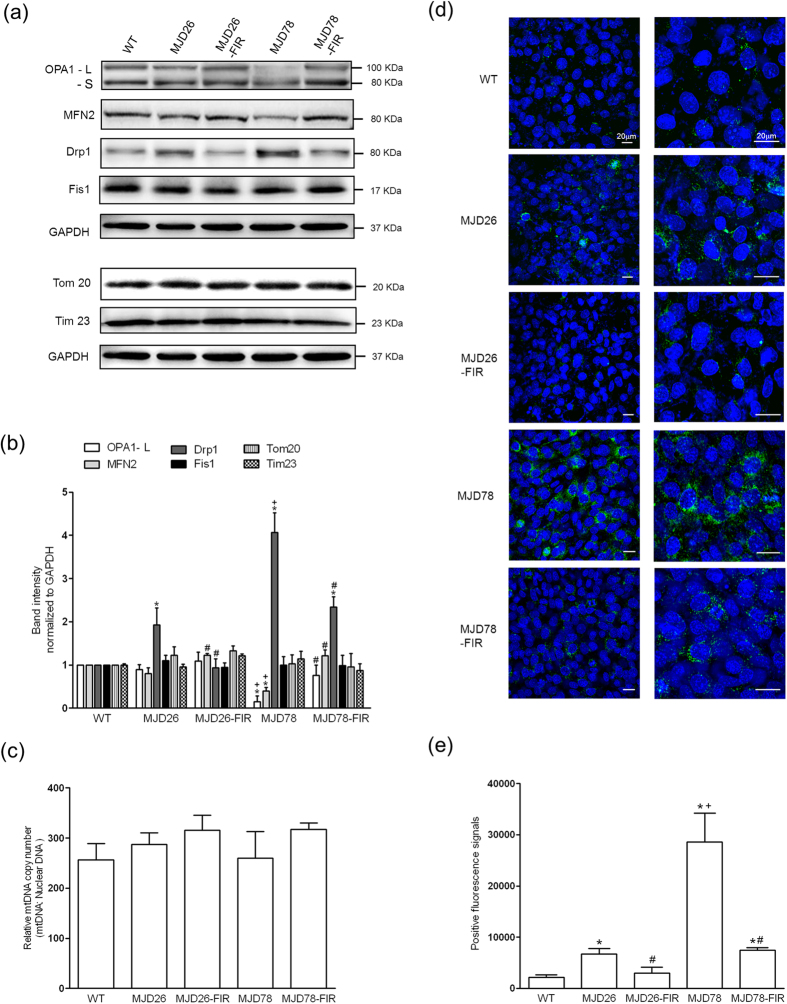
Figure 4. Performance of mitochondrial dynamic-related proteins and biogenesis in SCA3 cellular model under FIR treatment.
(a) Western blot analyzed the expression of mitochondrial fusion (Optic Atrophy 1, OPA1 and Mitofusin 2, MFN2) and fission proteins (Dynamin-related protein 1, Drp1 and Mitochondrial fission 1 protein, Fis1) as well as mitochondrial marker proteins (Tom 20 and Tim 23). OPA1 has two types of isoforms: long isoforms (OPA1-L) and short isoforms (OPA1-S). Only the L-OPA1 was fusion competent. (b) The above-mentioned protein expression was quantified by normalized Glyceraldehyde 3-phosphate dehydrogenase (GAPDH) (n = 3). (c) Mitochondrial DNA (mtDNA) copy number per diploid nuclear genome was analyzed by quantitative PCR to confirm the mitochondrial biogenesis (n = 4). (d) Expression of mitochondrial fission was further confirmed by examination of phosphorylation of Drp1 (Green color) at Serine 616 (p-Drp1) using immunofluorescent staining. The Hoechst 33342 was applied to the cell-permeant nuclear counterstain (blue color). (e) Fluorescent intensity of p-Drp1 was calculated by counting five independent areas at same magnification in each group (n = 3). *p < 0.05, compare to WT group; +p < 0.05, compare to MJD26 group; #p < 0.05, compare to each non-treated group of MJD cells.

