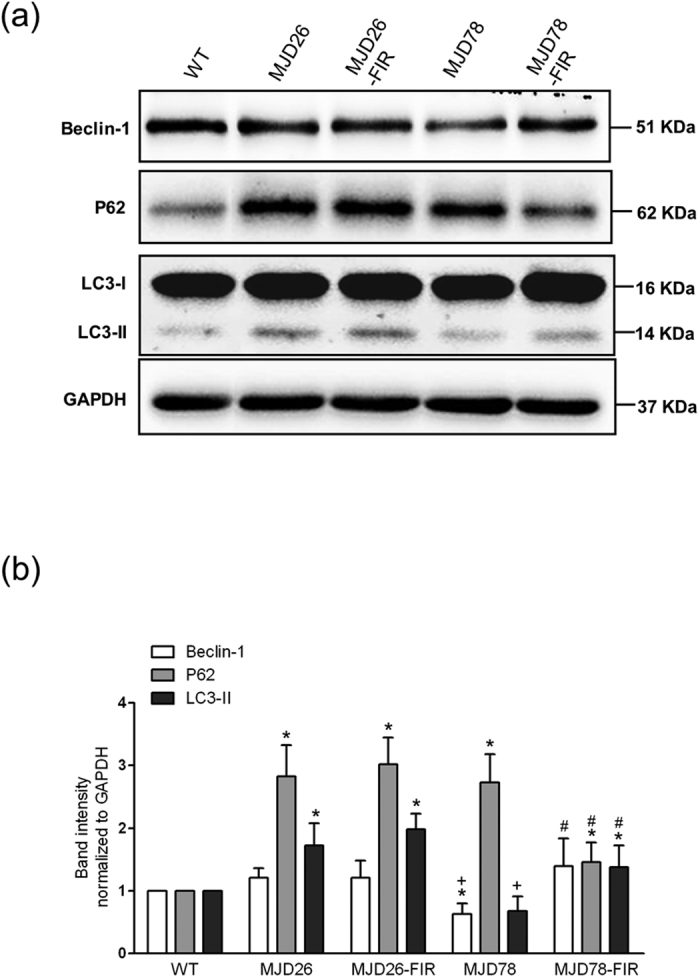
Figure 5. The expression of autophagic influx in MJD cells after 3-day FIR treatment.

(a) selective autophagy-related markers (Beclin-1 and microtubule-associated protein light chain 3-II, LC3-II) and autophagy substrate (P62) were analyzed by western blot and (b) quantified in human neuroblastoma cells (SK-N-SH) overexpressing 26- (26Q, internal control, MJD26) and 78-CAG repeats (MJD78) in ATXN3 with or with FIR treatment. The protein quantification was calculated by three-time independent analysis at least. *p < 0.05, compare to WT group; +p < 0.05, compare to MJD26 group, #p < 0.05, compare to each non-treated group of MJD cells.
