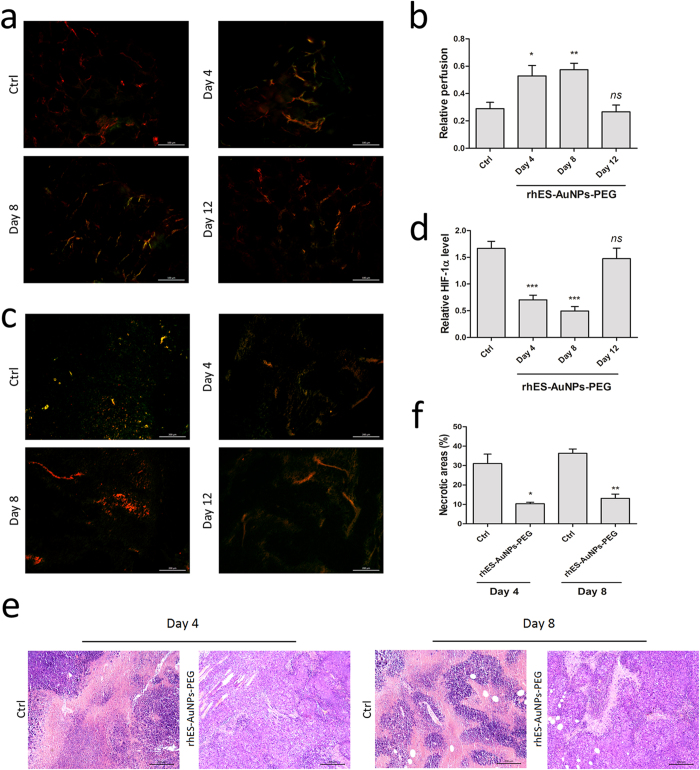
Figure 5. rhES-AuNPs-PEG increase blood perfusion and reduce hypoxia in tumour sections.
(a,b) Lectin perfusion and CD31 staining of tumour sections. The lectin+ area is presented as the percentage of the CD31+ area (*P < 0.05; **P < 0.01). Scale bars: 200 μm. (c,d) The ratio of the HIF-1α area/total area of the tumour section was determined and is presented as the relative value (***P < 0.001). Scale bars: 200 μm. (e,f) Necrotic areas in tumours after treatment for different times versus controls (*P < 0.05; **P < 0.01) (haematoxylin and eosin staining). Scale bars: 200 μm.

