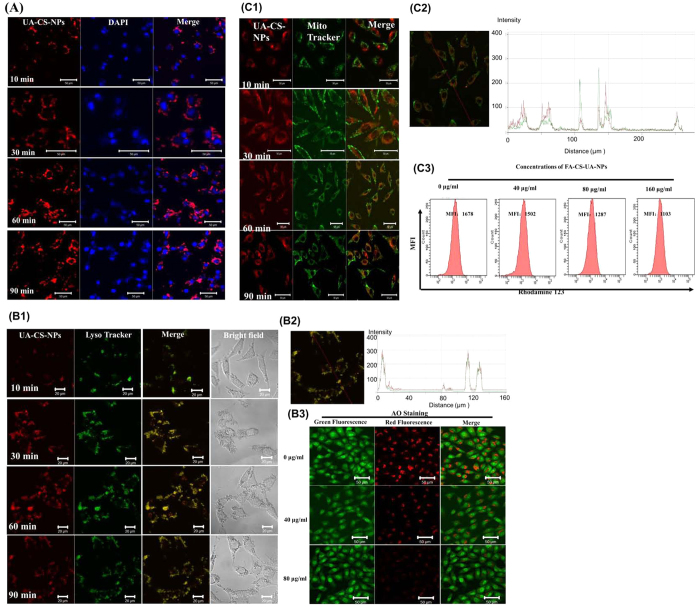
Figure 3. Intracellular trafficking of rhodamine B-loaded FA-CS-UA-NPs after internalized by MCF-7 cells.
(A) The FA-CS-UA-NPs (left column), cellular nuclei (middle column), and the merged images demonstrated that nanoparticles (red fluorescence) circumvented around the nuclei (blue fluorescence), but no overlay of the two kinds of fluorescence was observed, suggesting that nuclei were not the cellular targets of FA-CS-UA-NPs. Figure B1–B3 showed the effects of FA-UA-CS-NPs on cellular lysosome: (B1,B2) revealed the colocalization of FA-UA-CS-NPs (red) and lysosome (green) in MCF-7 cells after exposure to 20 μg/ml of FA-CS-UA-NPs for different periods of time; (B3) displayed integrity of the lysosomal membrane (AO staining) in MCF-7 cells after cultured with FA-CS-UA-NPs for 6 h, respectively. Scale bar: 20 μm. Figure C1–C3 showed effects of FA-UA-CS-NPs on mitochondria: (C1) revealed colocalization of FA-UA-CS-NPs (red) and mitochondria (green) in MCF-7 cells after exposure to 40 μg/ml FA- CS-UA- NPs for different periods; (C2) showed the profile indicated the colocalization of FA-UA-CS-NPs and mitochondria; (C3) compared ΔΨ in MCF-7 cells after cultured with FA-CS-UA-NPs for 6 h, respectively. Scale bar: 50 μm.

