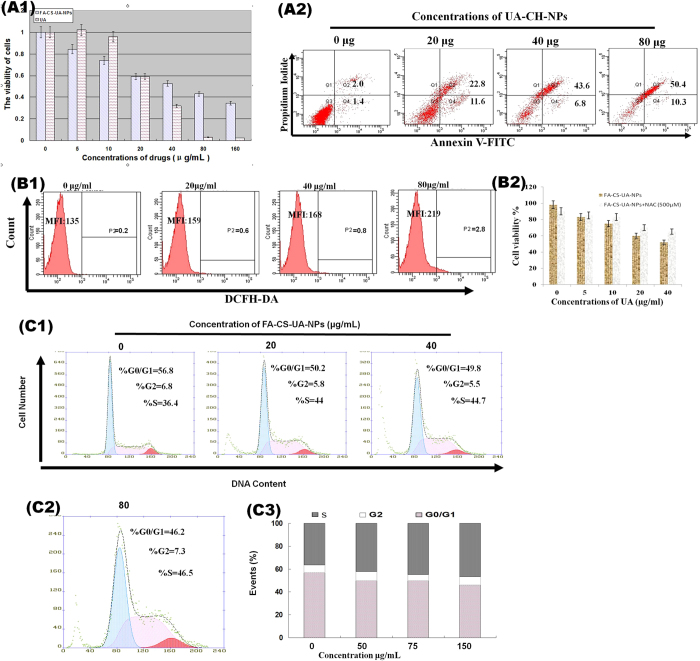
Figure 4. Effects of FA-CS-UA-NPs on cancer cell viability.
(A1) Showed comparative viability frequencies of MCF-7 cells treated for 48 h with different concentrations of UA (hatch bars) and FA-CS-UA-NPs (gray bars). Note that at doses of 40–120 μg/mL, FA-CS-UA-NPs induces significantly greater killing effects on MCF-7 cells than UA (P < 0.05 for comparisons between UA and FA-CS-UA-NPs groups). (A2) Showed representative flow cytometry histograms indicating dose-dependent increases in Annexin V-stained early apoptosis and PI-stained necrosis (late apoptosis) rates of MCF-7 cells induced after 48-hr treatment with different doses of FA-CS-UA-NPs. (B1) Showed that ROS generation in cells was indicated by MFI of DCFH-DA (fluorescent indicator of ROS). (B2) Showed that mean cell viability frequencies of MTT assay evaluating the effects of NAC on cell viability of MCF-7 cells. Cells were pretreated with 500 μM NAC for 4 h and then exposed for 24 h to FA-CS-UA-NPs. Note that NAC could block ROS production leading to reduction in FA-CS-UA-NPs-mediated killing. (C1–C3) showed the cell cycle alterations in MCF-7 cells treated for 24 h with different concentrations of FA-CS-UA-NPs. Note a dose-dependent S phase arrest.

