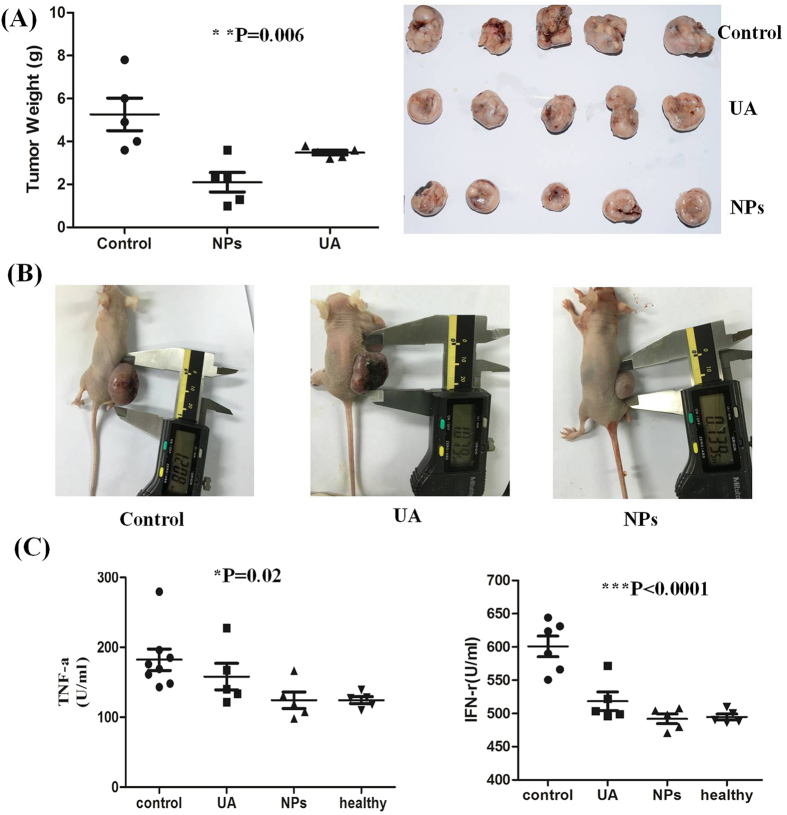
Figure 5. Anti-cancer efficacy of FA-CS-UA-NPs in MCF-7 nude mouse model.
(A) Mean weight and images of tumors after i.p. administrated with 0.2 ml of 0.9% physiological saline (Control group), 12.5 mg/kg b.w. ursolic acid (UA group) and 12.5 mg/kg b.w. FA-CS-UA-NPs (NPs group). (B) Representative images of tumor sizes in MCF-7 xenograft mice. (C) ELISA data of serum cytokines (TNF-αand INF-r) in different treated groups. P values indicating statistical significance are derived from ANOVA analysis of control, UA and UA-NPs groups. Nonparametric t test shows similar levels of significance.

