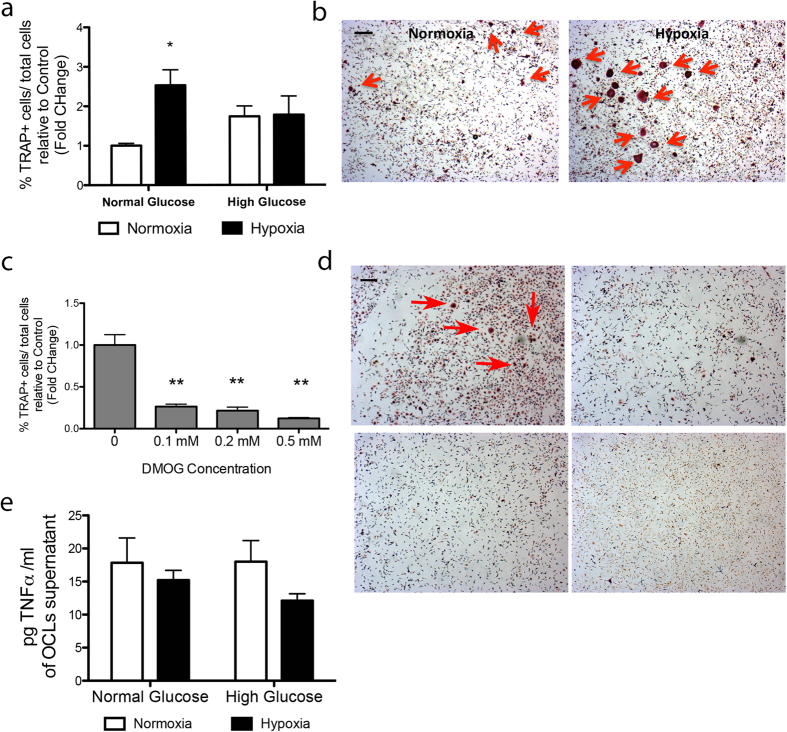
Figure 2. Effects of HG and hypoxia on osteoclast differentiation and activation in vitro.
Bar graphs (a) and representative microphotographs (b) show the abundance of TRAPpos osteoclasts derived from BM-MNCs cultured under normal/high glucose and normoxic/hypoxic conditions. Bar graphs (c) and representative microphotographs (d) show the abundance of TRAPpos osteoclasts derived from BM-MNCs exposed to the hypoxia mimic DMOG. Data are expressed as mean ± SEM. *p < 0.05 vs normoxia and **p < 0.01 vs 0 mM DMOG. n = 3 samples/group. Scale bar: 200 μm. Bar graphs show the level of TNFα in supernatants of BM-MNCs cultured in normoxia/hypoxia and normal/high glucose (e). n = 4 samples/group.

