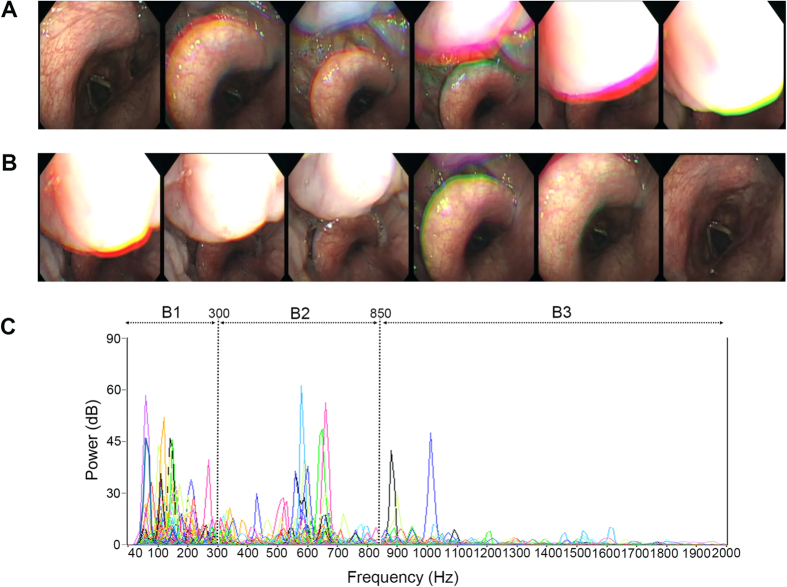
Figure 2. Multi-level obstructions.
Demonstration of drug-induced sleep endoscopy and power spectra of full-night snores of a 46-year-old man who had severe obstructive sleep apnea syndrome (apnea-hypopnea index = 62.5 events/hour) and multi-level obstructions (velopharynx, oropharynx, tongue base, and epiglottis). (A) Continuous photographs of the epiglottis showed that the epiglottis moved posteriorly and the tongue base gradually dropped. (B) After the tongue base had pushed the epiglottitis backward, the completely obstructed airway became patent again. (C) The power spectra of full-night snores showed diverse peak sound frequencies in low- (B1: 40–300 Hz), mid- (B2: 301–850 Hz), and high- (B3: 851–2000 Hz) frequency bands with various sound intensities.

