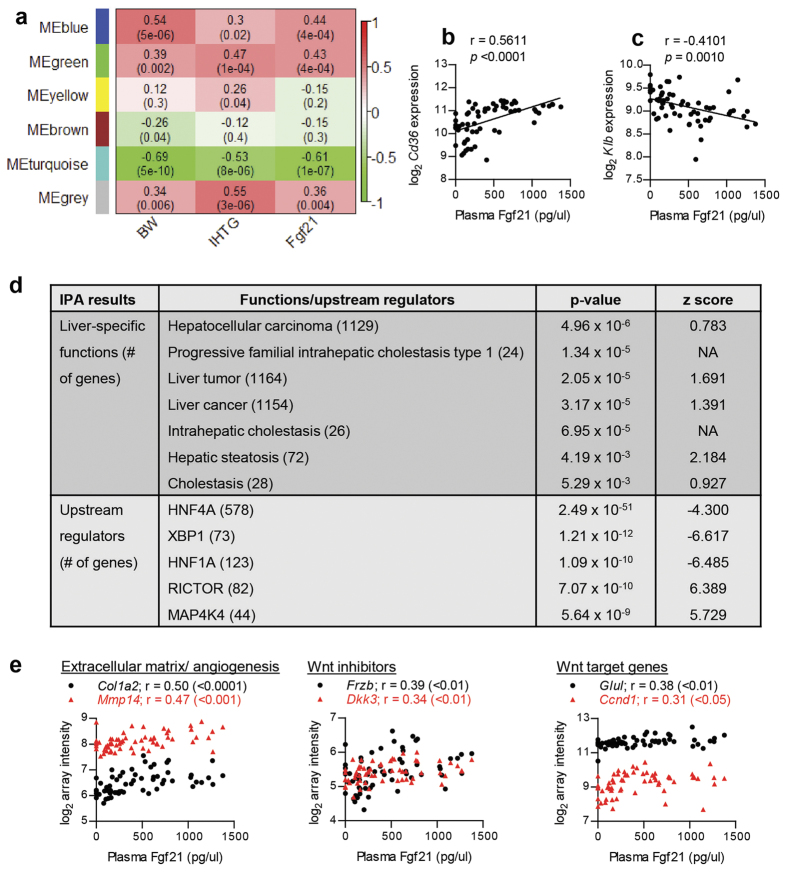
Figure 4. Liver biological processes associated with plasma Fgf21 level.
(a) Heatmap depicting the correlation between gene modules (in rows) and phenotypes (in columns). The top values in each cell represents the correlation coefficient between the module and phenotype with the correlation p-value in parentheses. Red and green color represents positive and negative correlation, respectively. Correlation between plasma Fgf21 levels and hepatic expressions of Cd36 (b) and Klb (c). (d) Biological processes and regulators associated with MEturquoise, which is the most significant modules correlated with plasma Fgf21. Significant liver-specific functions and upstream regulators are reported in p-values and z-scores. Positive and negative z-score represent predicted activation and inhibition, respectively. (e) Correlation between plasma Fgf21 and expression levels of hepatocellular carcinoma-related genes within MEturqouise, which included genes related to extracellular matrix formation and angiogenesis (Col1a2 and Mmp14), inhibition of Wnt signalling (Frzb and Dkk3), and downstream target of Wnt signalling (Glul and Ccnd1). r values were calculated with Pearson’s correlations and their significance are indicated in the parentheses.

