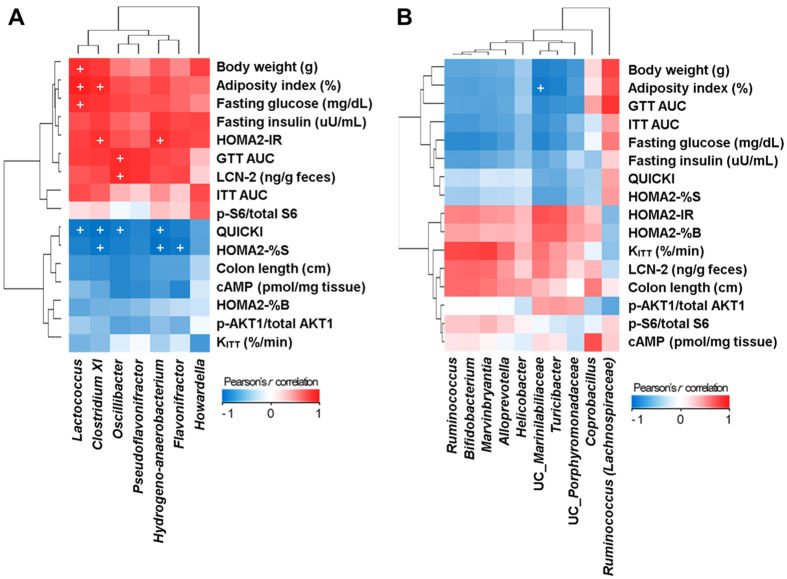
Figure 5.
Pearson’s r correlation coefficients heat maps showing the association between metabolic markers and the abundance of specific bacterial genera after (A) resveratrol or (B) rapamycin treatment. Given the large number of correlation tests performed, a significance threshold of P < 0.005 was used, which is indicated by ‘+’.

