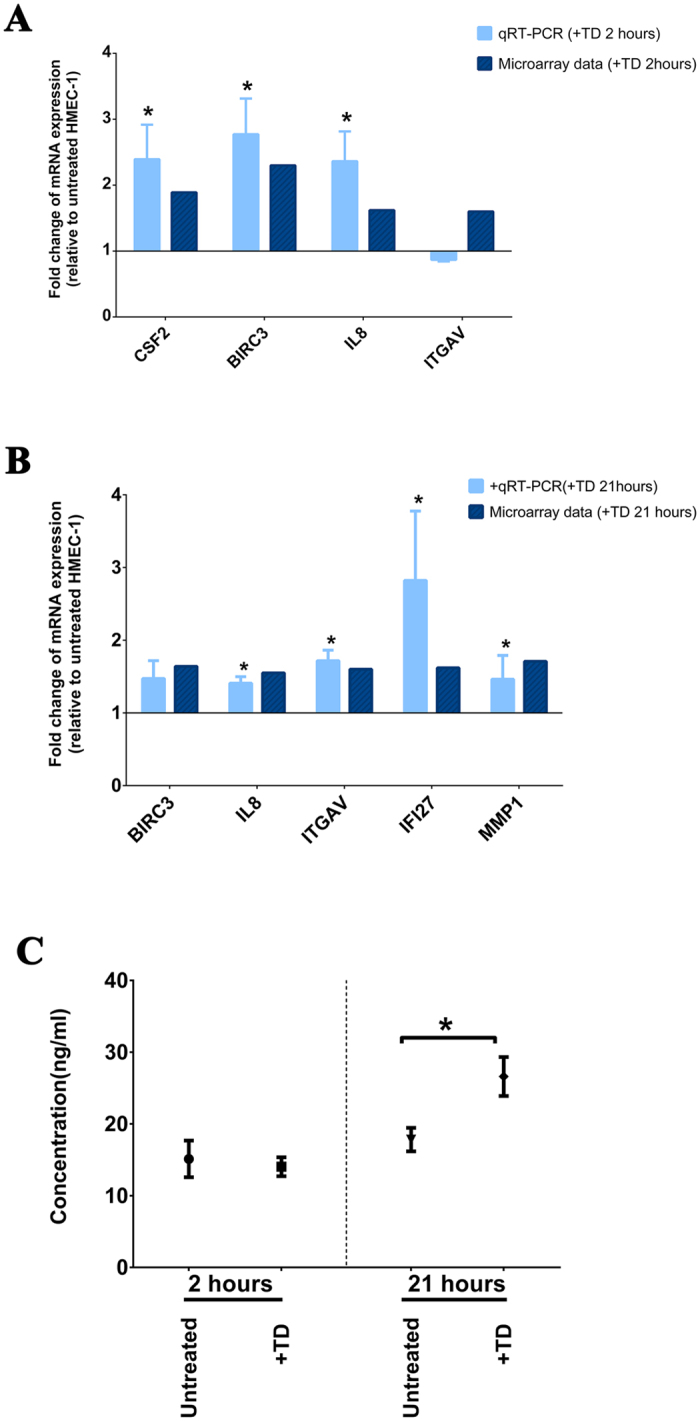
Figure 1. Quantitative RT-PCR Validation of microarray results.

(A) The expression of four genes (CSF2, BIRC3, IL8, and ITGAV) in HMEC-1 cells by trophoblastic debris (+TD) following 2 hours exposure was validated by qRT-PCR. The expression was normalized to the geometric mean of housekeeping genes: RPLP0; ACTB and PPIA. Bar graphs represent the fold change of the mRNA expression relative to the control HMEC-1 cells by either qRT-PCR or microarray. Data are presented as mean ± SEM. *Indicates p-value < 0.01. (B) The expression of five genes (BIRC3, IL8, ITGAV, IFI27 and MMP1) in HMEC-1 cells by trophoblastic debris (+TD) following 21 hours exposure was validated by qRT-PCR. The expression was normalized to the geometric mean of housekeeping genes: RPLP0; ACTB and PPIA. Bar graphs represent the fold change of the mRNA expression relative to the control HMEC-1 cells by either qRT-PCR or microarray. Data are presented as mean ± SEM. *Indicates p-value < 0.01. (C) Levels of IL-8 in conditioned media from HMEC-1 cells after 2 and 21 hours exposure to trophoblastic debris (TD) (collected from 6 individual placentae) were quantified by ELISA. Data are presented as mean ± SEM. *p < 0.05.
