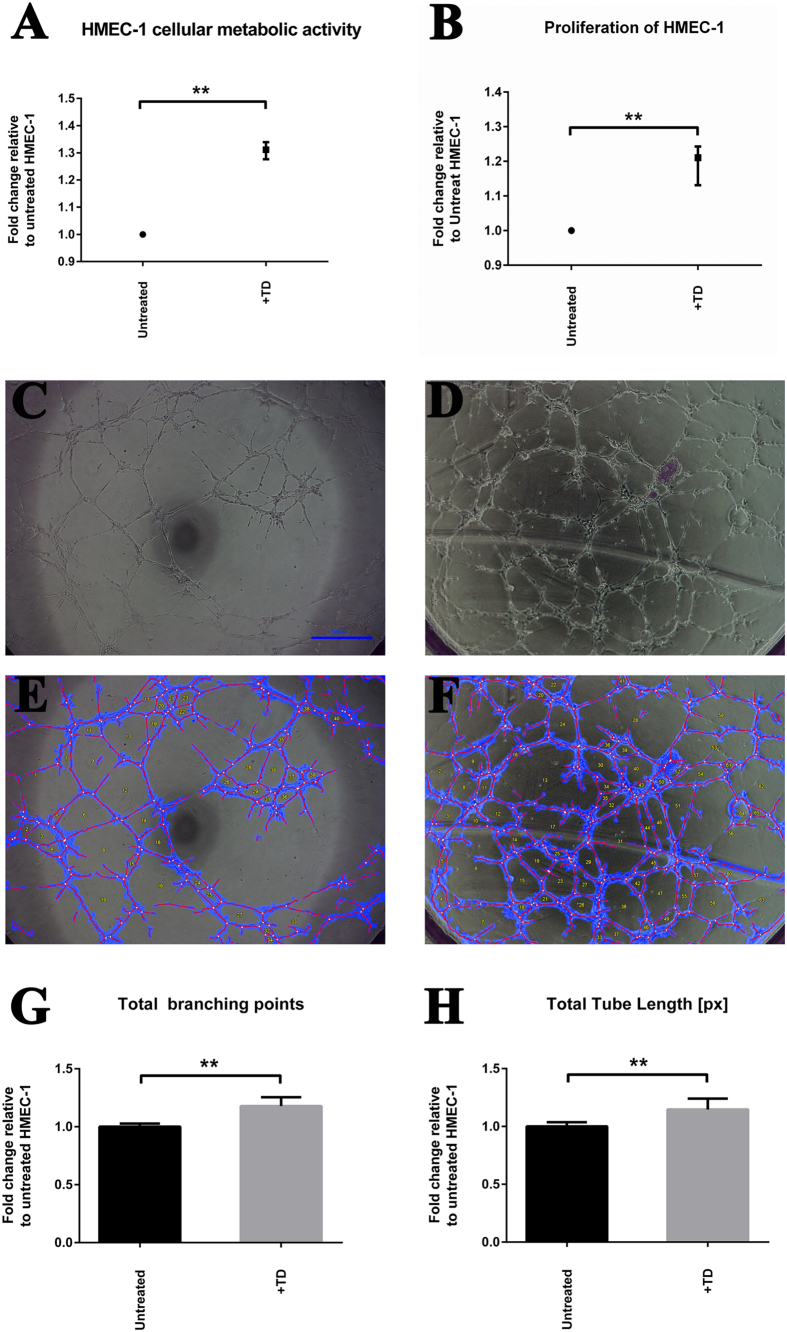
Figure 2. The proliferation and angiogenic capacity of HMEC-1 cells exposed to trophoblastic debris.
(A) The cellular metabolic capacity of HMEC-1 cells treated with trophoblastic debris (TD, collected from 9 individual placentae) for 48 hours was investigated by AlamarBlue cell viability reagent. Data are presented as median ± interquartile range with p < 0.0001. (B) Cellular DNA contents of HMEC-1 cells treated with TD (isolated from 6 individual placentae) for 48 hours were investigated with CyQUANT cell proliferation assay. Data are presented as median ± interquartile range with p < 0.005. (C) Representative light microscope image of untreated HMEC-1 on growth factor reduced (GFR) matrigel at 4 hours; bar represents 500 μm. (D) Representative light microscope image of HMEC-1 treated with TD on GFR matrigel; bar represents 500 μm. (E) Representative automated images of untreated HMEC-1 using WimTube software. (F) Representative automated images of HMEC-1 treated with TD using WimTube software. (G) Total branching points generated from images of HMEC-1 cells and HMEC-1 cells treated with TD (n = 3 independent experiments). Data are presented as mean ± SD. p < 0.005. (H) Total tube length generated from images of HMEC-1 cells and HMEC-1 cells treated with TD (n = 3 independent experiments). Data are presented as mean ± SD. p < 0.005.

