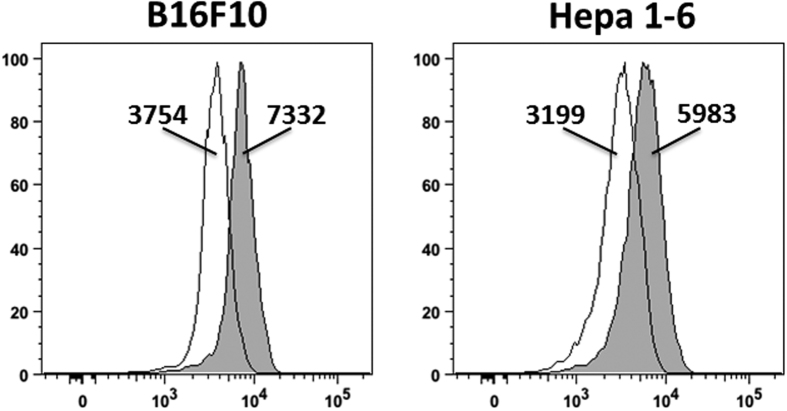
Figure 2. B16F10 and Hepa 1–6 tumour cells express uPA.
uPA expression was analysed in B16F10 and Hepa 1–6 tumour cells by flow cytometry using biotinylated anti-uPA antibody, revealed with PE-conjugated streptavidin (filled histogram) or second step only (empty histogram). The geomean fluorescence intensity is indicated. Results shown are representative for 2 experiments.

