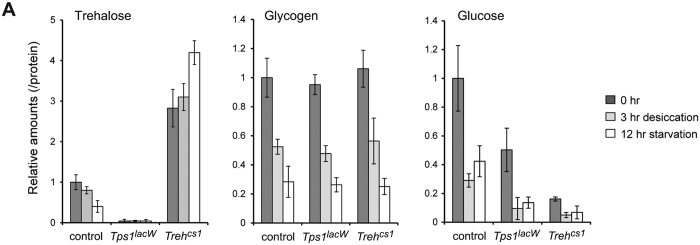
Figure 6. Changes in sugar levels following desiccation and starvation stress.
(A) The amounts of trehalose, glycogen, and glucose were analyzed in early third-instar larvae following desiccation and starvation stress. Each value was normalized by protein levels and further normalized according to the level in the control larvae. All the values are means and SD (n > 3).

