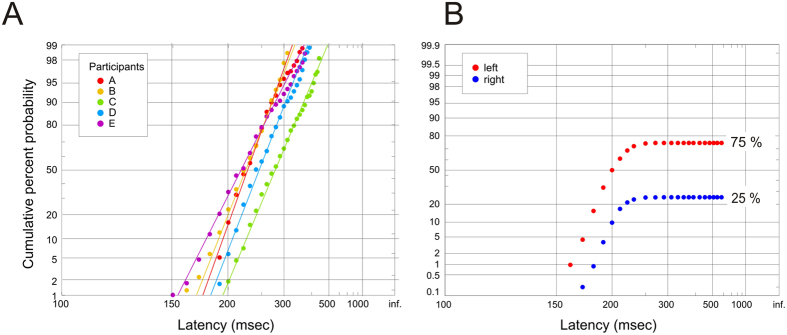
Figure 2. Reciprobit plots.
(A) Cumulative histograms for each subject of reaction time distributions for 100%, 98% and 95% support for a particular direction, shown as ‘complete’ reciprobit plots, i.e. as a proportion of responses in that direction only. The lines are the best-fit expectations from the LATER model. In each case the data are very well fitted by the model, as shown by the superimposed lines, which are obtained by best-fit of μ and σ by minimization of the Kolmogorov-Smirnov one-sample test: p = 0.87, 0.93, 0.94, 0.85, 0.85. (B) The expected form of the reciprobit plots for responses to left and right to a stimulus in which the leftward support is high and the rightward support correspondingly low. They are plotted as ‘incomplete’ distributions, i.e. as a proportion of the total responses in both directions (whereas the complete distributions in A represent the proportion of responses in the same direction only). Consequently they level off to give the final response rates in each direction, in this case 25% to the right and 75% to the left.

