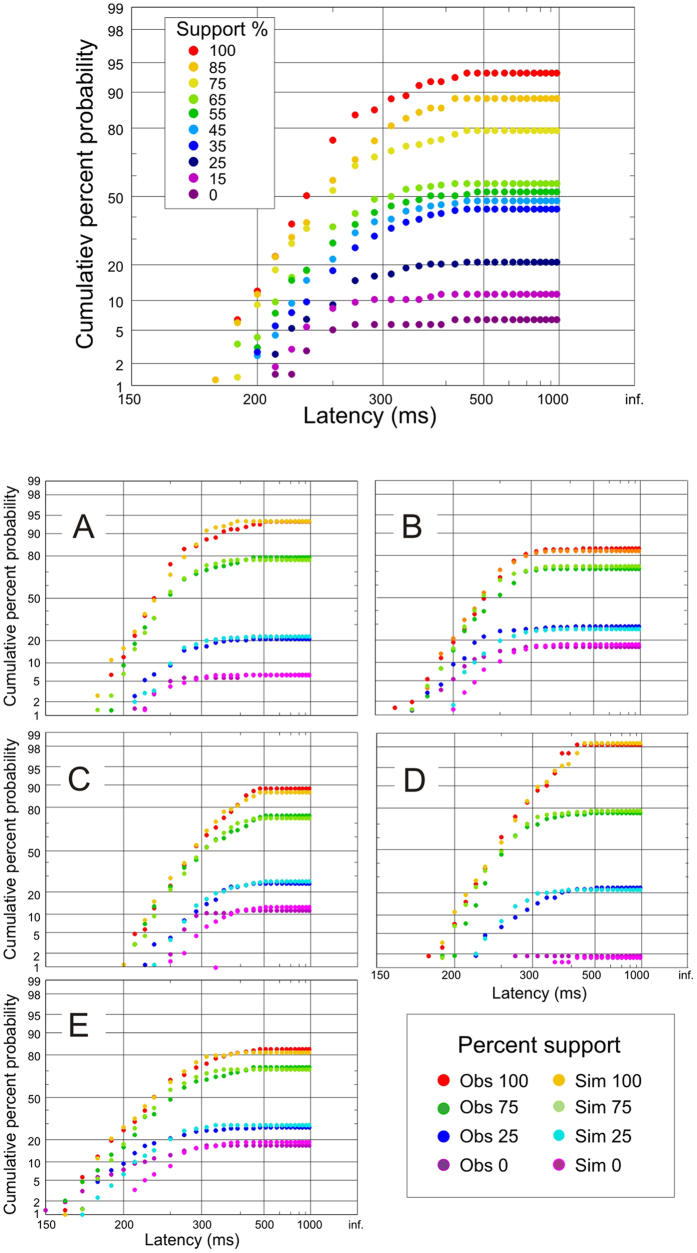
Figure 4. Observed and simulated reaction time distributions.
Above: ‘incomplete’ reciprobit plots (as in Fig. 2B) for subject A for all of the different degrees of support. Below: comparison of observed (Obs) and simulated (Sim) distributions for the supports shown, for all participants.

