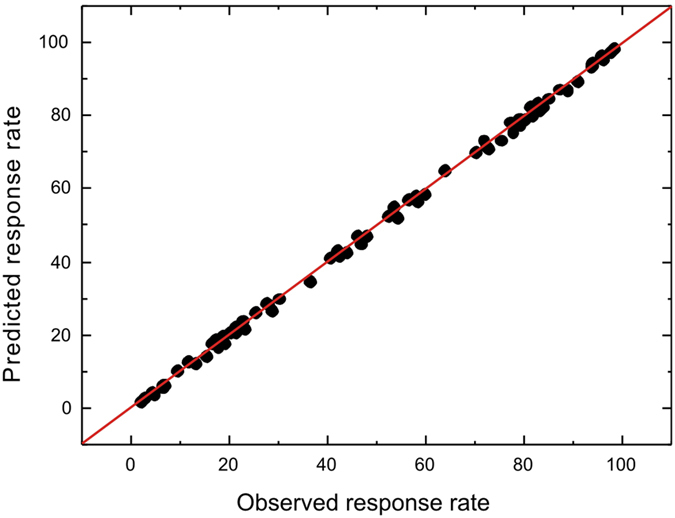
Figure 5. Accuracy of the model in predicting response rates.

The points show the relationship between the observed and simulated final response rates for all participants and degrees of support. The line represents the exact equality between simulations and observations expected if the model’s predictions were perfect.
