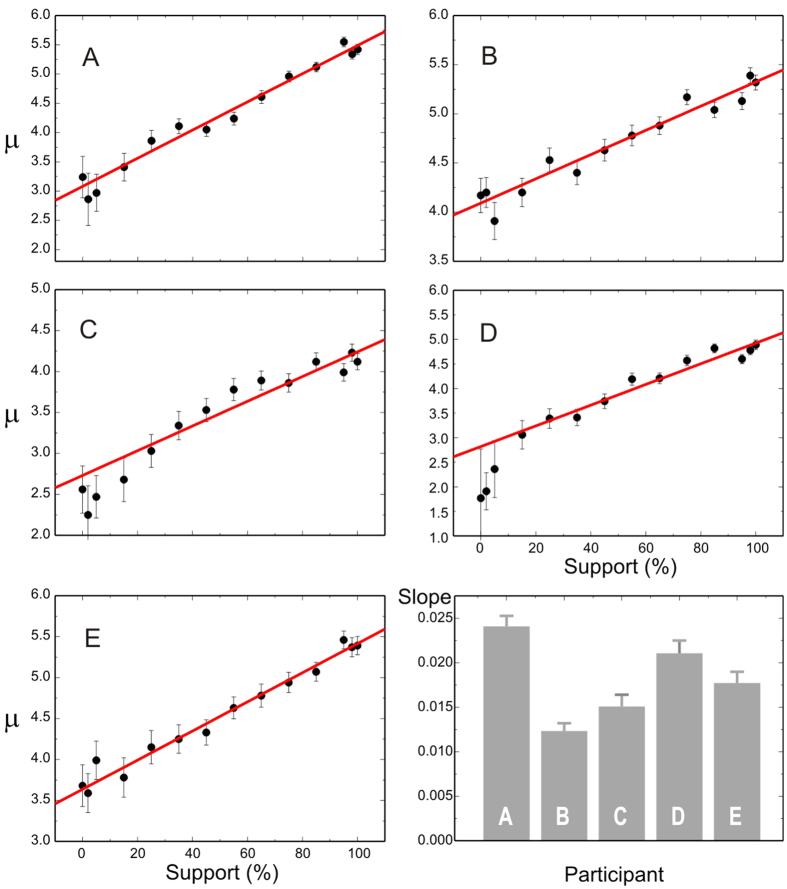
Figure 6. Relation between μ and degree of support.
(A–E) Best-fit values of μ (Hz) as a function of support for all participants. The lines show the result of weighted linear regressions; the error bars show ±1 SE, necessarily larger for low support because the data-sets are smaller. Pearson’s correlation coefficients for each participant were as follows: (A) R = 0.982; B, 0.967; C, 0.942; D, 0.942; E, 0.989). Bottom right: the values of the slopes of these lines (Hz per percent, ±1 SE) for each participant.

