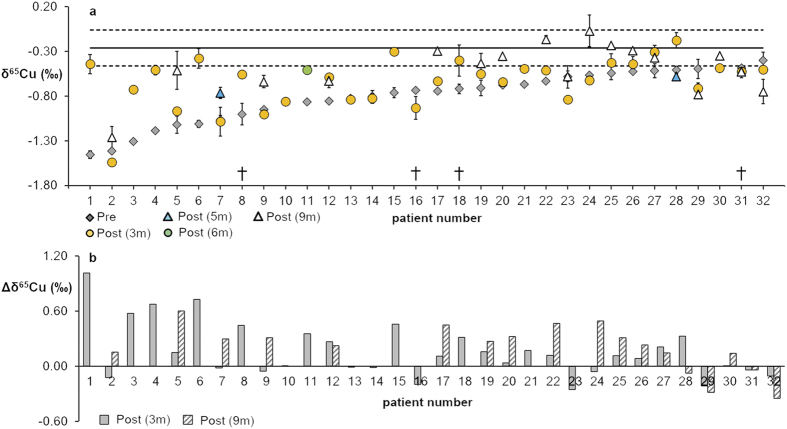
Figure 2. δ65Cu and Δδ65Cu values in serum samples of pre- and post-LTx (3 and 9 months) patients.
(a) δ65Cu values. Error bars represent 2 s.d. The full line represents the average value for healthy individuals as reported by Albarède et al.24. The dotted lines represent ± 1 s.d. on this average. For patient 11, a serum sample 3 months post-LTX was not available and a sample collected 6 months post-LTx was included instead. For patients 7 and 28, serum samples 9 months post-LTx were not available and samples collected 5 months post-LTx were analysed instead. The low δ65Cu values observed in the ESLD population tend to increase post-LTx. (b) Δδ65Cu values.

