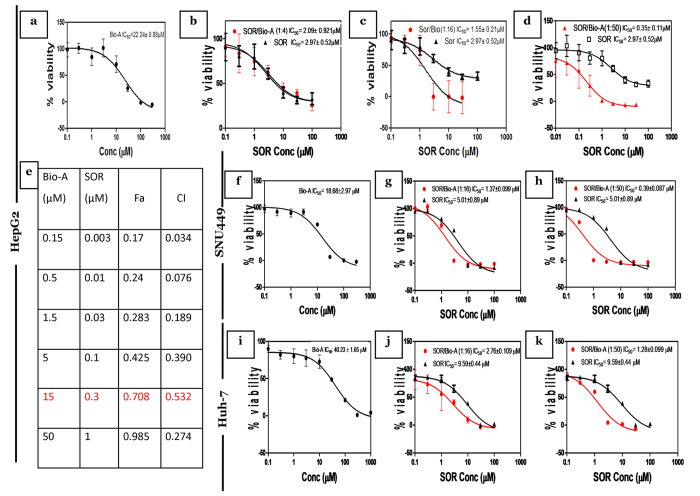
Figure 1. Effect of Bio-A on SOR-mediated cytotoxicity in HCC cells after 72 h treatment.
Concentration-response plot of: (a,f,i) Bio-A single treatment, (b) SOR/Bio-A combination ratio 1:4 in HepG2 cells, (c,g,j) 1:16, (d,h,k) 1:50 combination ratios in HepG2, SNU 449 and Huh-7, respectively. Data are mean ± SD (n = 6). (e) Table showing synergy analysis of 1:50 SOR/Bio-A in HepG2 cells.

